Stop squinting at 10-K tables. Sankify turns SEC filings into interactive income-statement Sankey diagrams — as-reported numbers, validated accounting, styled to your brand, exported at social and slide sizes — in about ten seconds. Then scrub any company across six fiscal years with Time analysis.
First chart free · 7-day free trial on every plan · Cancel anytime
Loading a live filing…
Data source
SEC EDGAR, read directly
Accuracy
Accounting identities validated on every chart
Coverage
200 companies live · Fortune 500 expansion underway
Getting started
7-day free trial on every subscription
Why flows
The table hides the story. The flow tells it.
This is Apple’s actual FY2024 10-K — first the way the SEC receives it, then the way Sankify draws it. Same numbers, ten seconds apart. No spreadsheet in between.
AAPL Form 10-K · Consolidated Statements of Operations
Products
294,866
Services
96,169
Total net sales
391,035
Cost of sales
(210,352)
Gross margin
180,683
Research and development
(31,370)
Selling, general and administrative
(26,097)
Operating income
123,216
Provision for income taxes
(29,749)
Net income
93,736
In millions. As filed with the SEC.
Sankify · Apple FY2024 Income Statement
⏱ Generated in ~10 seconds
✓ Identities validated
→
Every ribbon is traceable to the line item it came from — hover any flow in the real product to see the filing figure behind it.
The tool
Pick a ticker. Watch it flow.
This is the actual product, not a demo reel — the same form paying users run. Choose a company and period; the filing is fetched and drawn as a flow.
Popular now:
How it works
Filing in. Chart out.
1
Pick a ticker and period
Any supported company. Annual or any quarter — including synthesized Q4s that reconcile to the 10-K. Loss years render too, drawn as losses.
2
Generate in seconds
No data prep, no concept mapping, no code. The filing is fetched from EDGAR and drawn as a flow.
3
Explore — and travel in time
Hover any ribbon to trace a line item from segment to net income, or flip on Time analysis to scrub the same company across six fiscal years.
4
Style, size, and ship it
Brand palettes, backgrounds, fonts, notes and your logo — then export at exact sizes, from 1080×1080 squares to 1920×1080 slides.
Sankify is built for people whose reputation rides on the numbers. Every Sankey is generated from the company’s own filings and checked against accounting identities before it renders. If the chart exists, the math holds.
✓
As-reported figures from SEC EDGAR
Every number is read from the company’s own XBRL filing — the same data the SEC publishes. No third-party re-typing.
✓
Accounting identities checked before render
Gross profit must equal revenue minus cost of revenue. Segments cannot exceed their totals. A chart that fails its checks doesn’t ship.
✓
Fiscal calendars handled company by company
Apple’s September year-end, NVIDIA’s January close, Walmart’s Q4 that spans two calendar years — periods land where the filer put them.
The studio
Generate it in seconds. Make it yours.
Every chart opens into a full styling studio — brand colors, backgrounds, typography, annotations, and export framing — so what you publish looks like yours, not ours.
New · Time analysis
Scrub a company through time.
Flip on Time analysis and the chart becomes a past-performance timeline: a revenue sparkline spanning the last six fiscal years, with the full income-statement flow redrawing for whichever year you select. That’s NVIDIA going from $17B to $216B, playing on the right.
One click paints revenue and every segment feeding it in the company’s brand color — NVIDIA green, Microsoft blue, Tesla red — plus five preset themes, with expenses and profits still reading like an income statement.
Backgrounds & depth
Sankify · Background
White · flat
Dots · node shadow
Grid · node shadow
Midnight · light text
Backgrounds & depth
Paper, mint, dot and grid textures, dark slate and midnight canvases, or any custom color — with an optional soft node shadow for depth. Backgrounds export with the chart.
Label control
Sankify · Edit mode
Drag labels anywhere
Click a label to select it
Recolor one label — or all
Add notes & your logo
Full text & label control
Drag labels anywhere, rewrite names and values, recolor one label or all of them at once, switch fonts, drop in notes and your own logo. Edit like a design tool — the whole chart fits on screen, no scrolling.
Export framing
Sankify · Export
Export area · Square · 1080×1080
Export area · Landscape · 1920×1080
Export area · Portrait · 1080×1350
Export area · Story · 1080×1920
Sized for where it’s going
Export at exact canvas sizes — 1080×1080 square, 1920×1080 slides, portrait and story formats — with a live outline on the canvas while you edit, so you compose to the frame before you download.
Filing alerts
Earnings season, delivered.
Once you know which companies you care about, you shouldn't have to come back and rebuild the same chart every quarter. Watch up to five companies and the moment a new 10-K or 10-Q hits EDGAR, the chart lands in your inbox — rendered in your saved style, with the headline numbers already pulled out.
✓ Your chart, your look — the style you set in the editor is the style in the email
✓ Revenue, growth, and margins at a glance, before you even click
✓ One click opens the full interactive chart on the new period
✓ 5 companies included on every plan — add more anytime
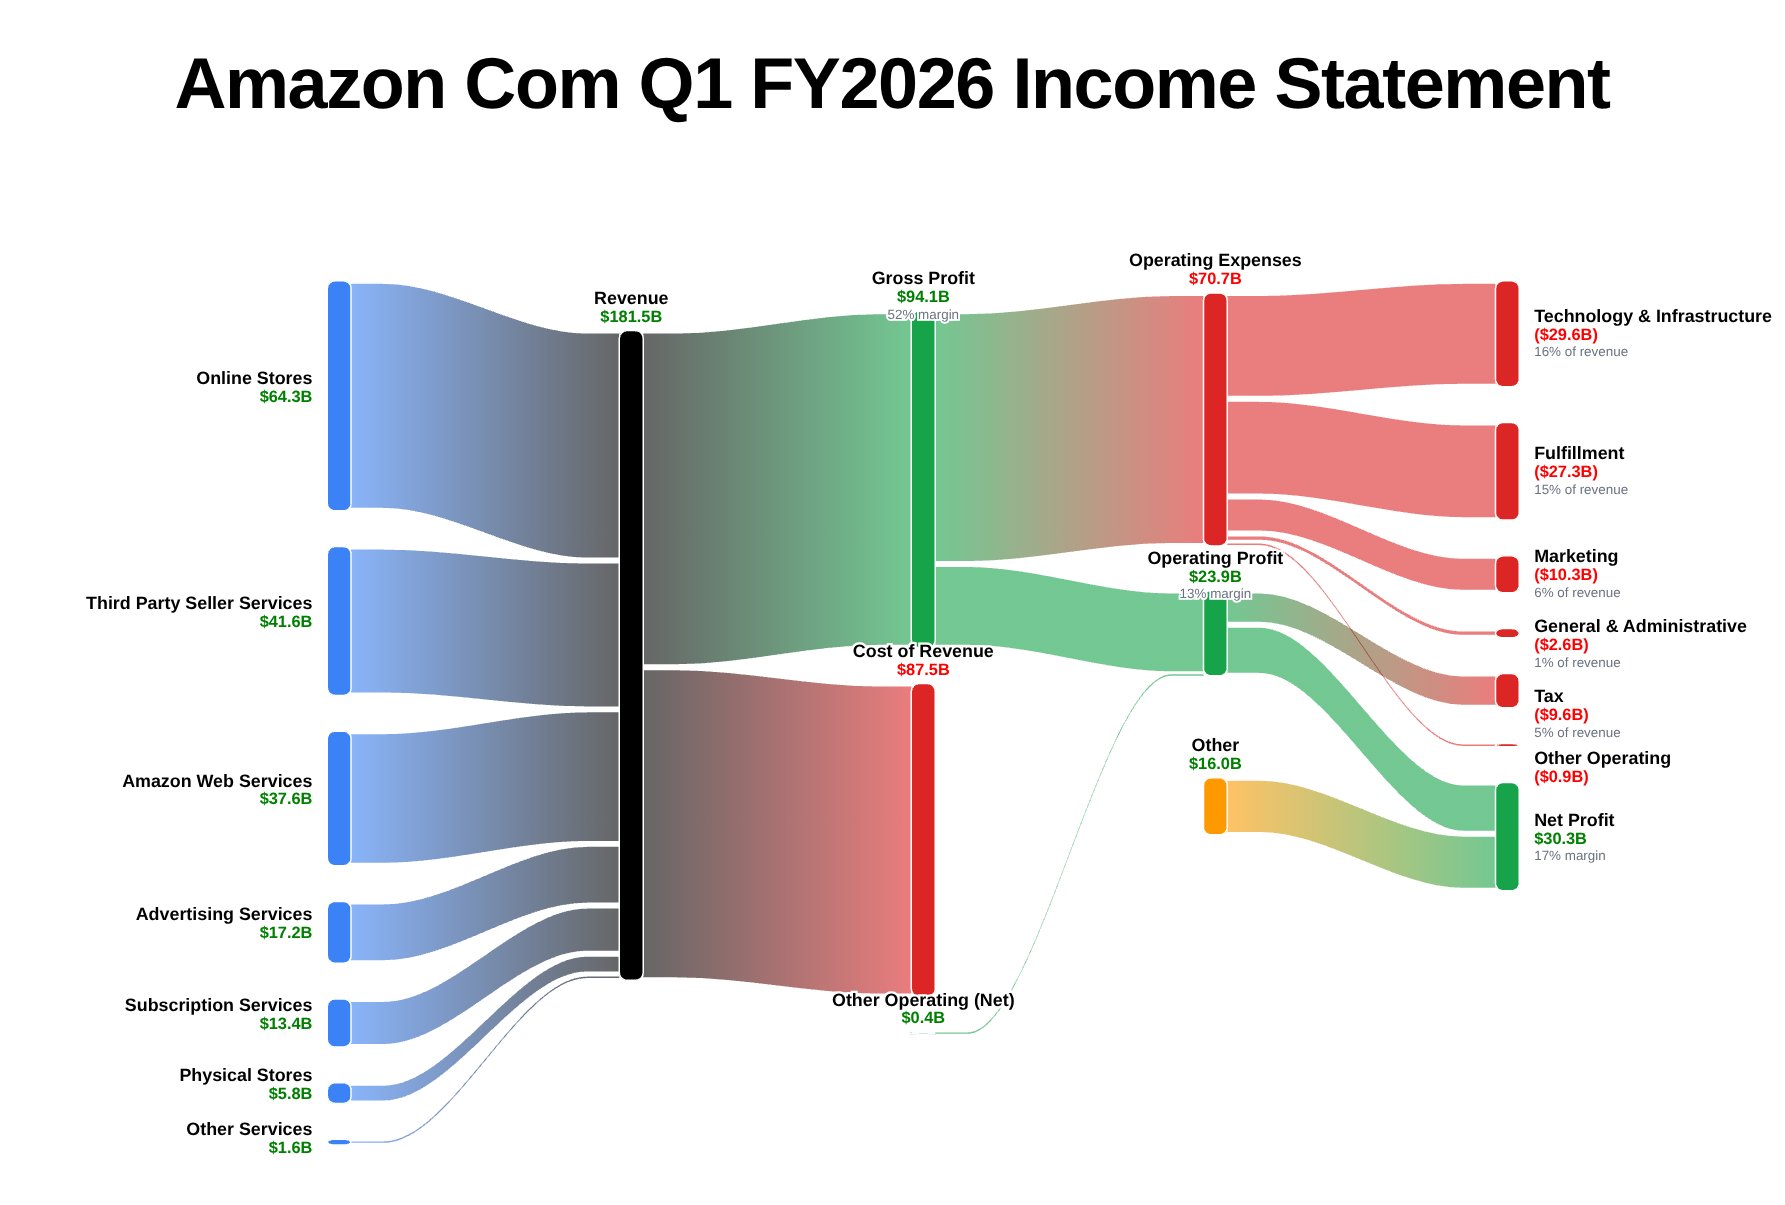
Q1 FY2026 — period ending March 31, 2026 — is live on SEC EDGAR.
Revenue
$181.5B
▲ 16.6% Y/Y
Net profit
$30.3B
Gross margin
52%
Net margin
17%
Open the interactive chart →
Who it’s for
Built for people who read filings
📈
Equity analysts
Open your earnings note with the one chart the whole meeting remembers.
🤝
Advisors & consultants
Client-ready exports without a designer — and numbers the client can verify.
🎓
Professors & students
Teach the income statement as a picture. Assign any company, any period.
💼
Investors & strategists
Understand how a business actually makes money before the market narrative does.
Coverage
200 companies live. The Fortune 500 is next.
Every supported company is one click from its live chart — including loss years, drawn as losses. The expansion across the most-requested Fortune 500 names continues on the same validated pipeline, each company grounded in its own filings before it ships.
Progressive · soonUPS · soon
Pricing
Transparent pricing. No sales call.
Free gets you 3 charts a day on the biggest names. Paid plans open every supported company and period, and start with a 7-day free trial. Cancel anytime.