JPMorgan vs. Goldman: Same Morning, Opposite Headlines
JPMorgan's and Goldman Sachs's fiscal 2025 income statements as Sankey charts, published the day both banks opened earnings season in opposite directions.
Bank earnings season opened this morning with a split verdict. JPMorgan missed, reporting $5.57 of earnings per share against the $5.93 analysts expected, according to CNBC's live coverage, while Goldman Sachs beat on nearly every line, with net revenues up 23% and earnings of $17.01 per share, per the earnings release. Quarters are weather. The two charts below are closer to climate, each bank's full fiscal 2025 income statement drawn from its own SEC filings.
---
JPMorgan Chase & Co. (JPM), Fiscal 2025
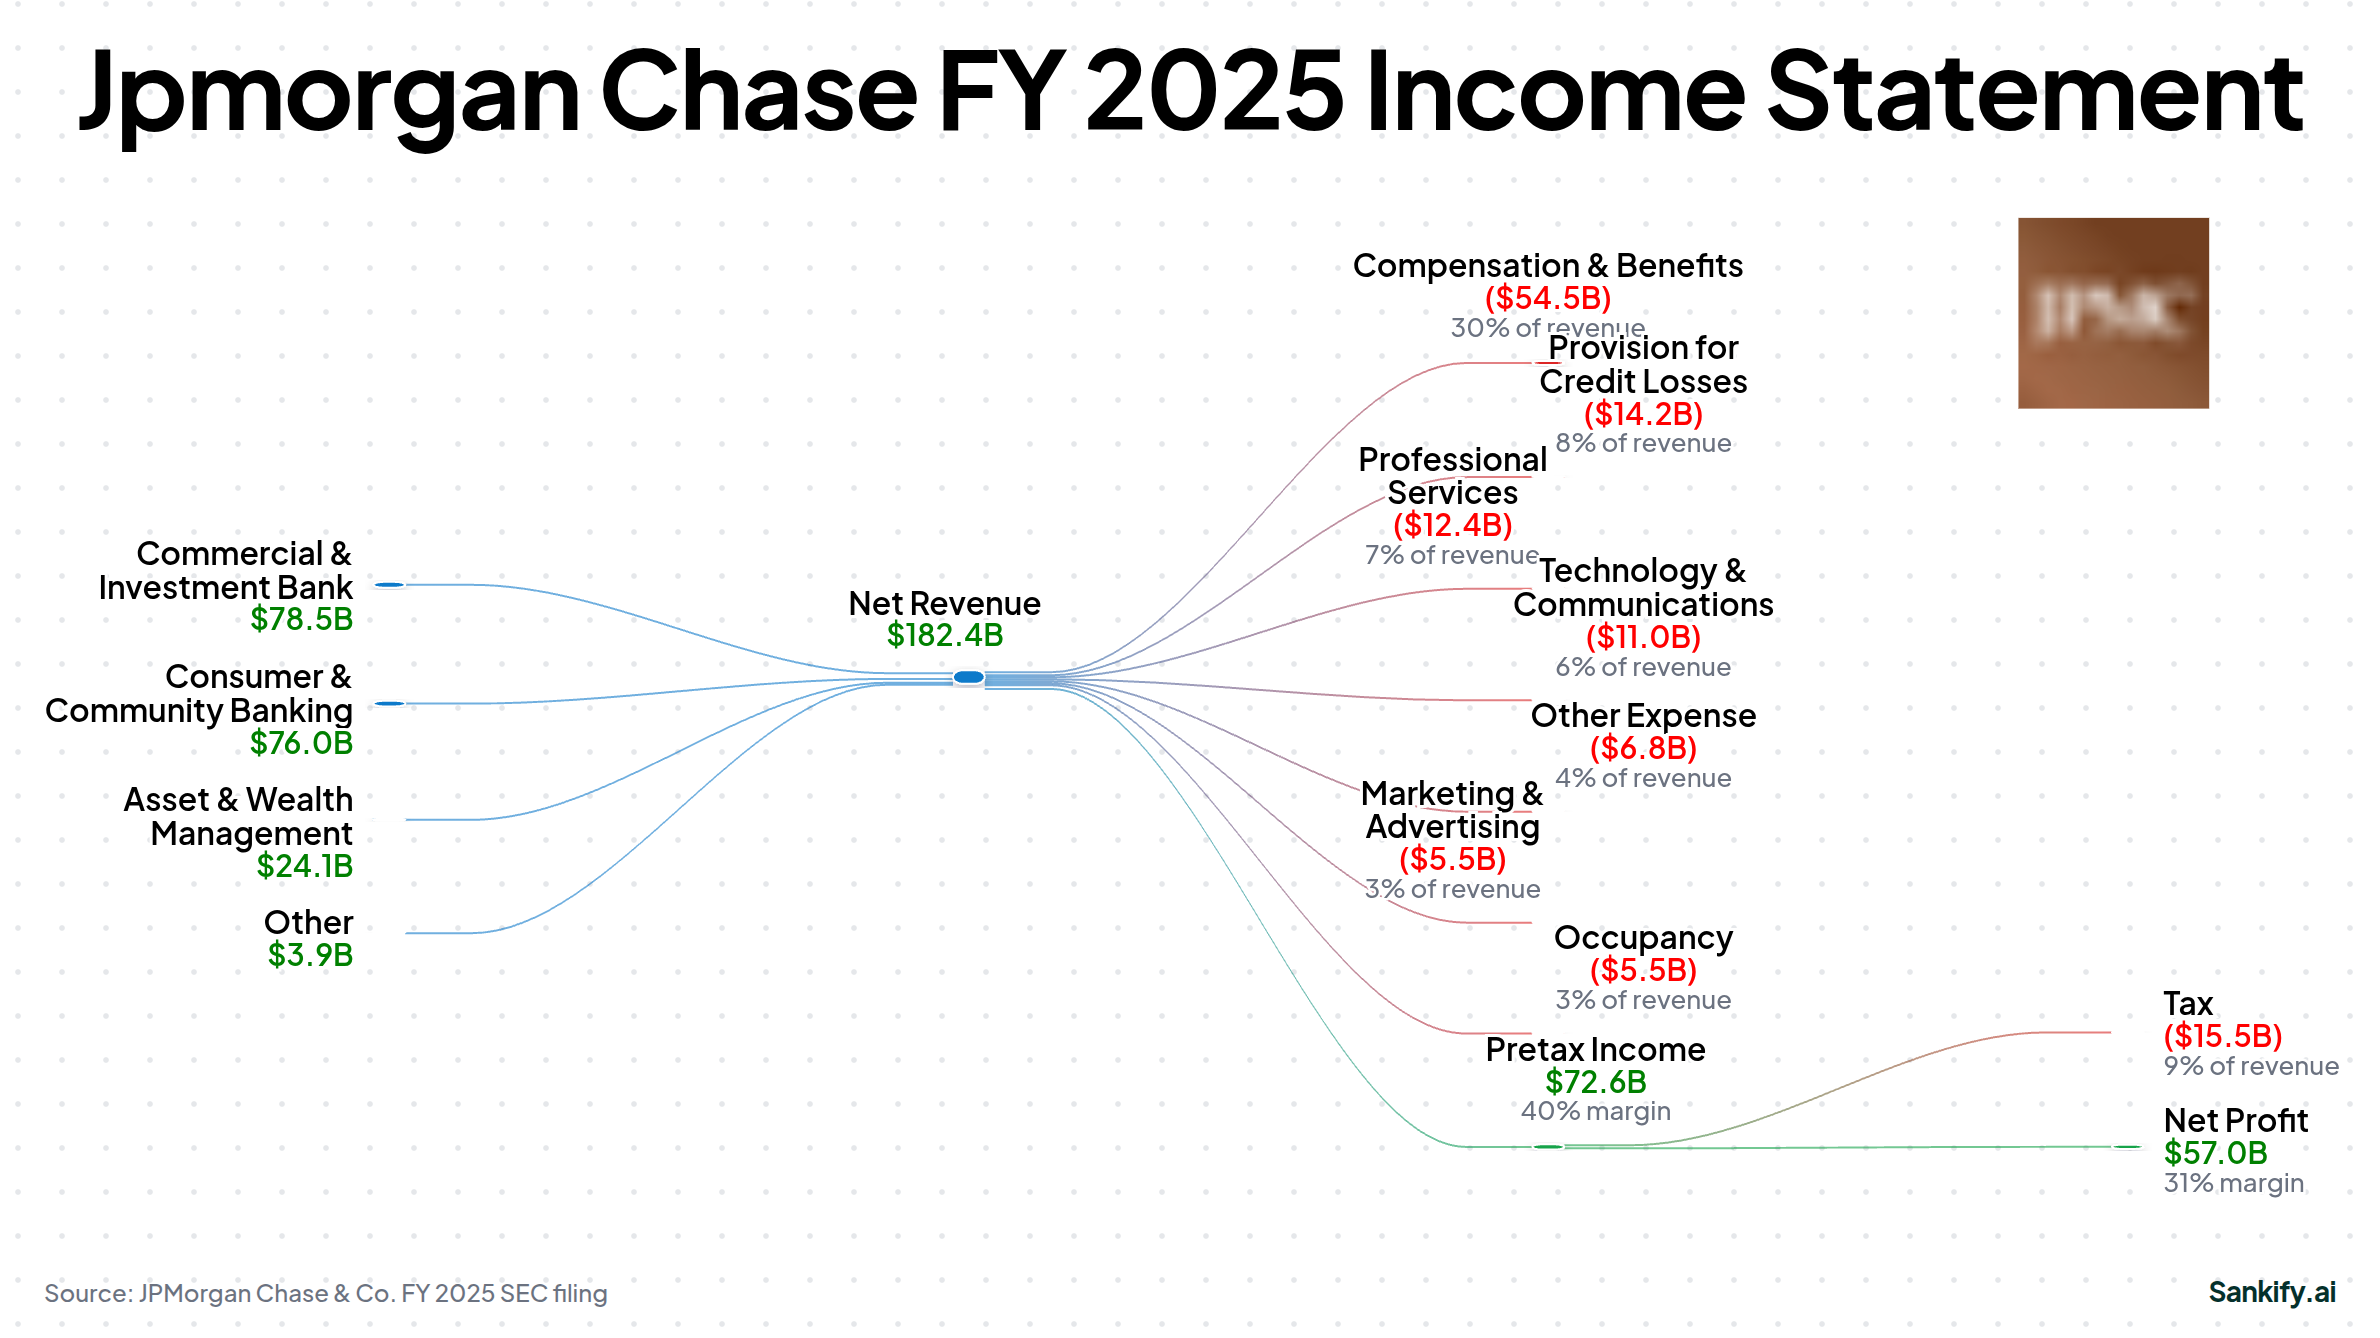
JPMorgan Chase & Co.'s FY2025 revenue was $182B, up 3% year over year; net income $57.0B (31% margin).
JPMorgan's chart looks like an economy. Net interest income feeds one side of the $182 billion revenue hub and fee businesses feed the other, and what narrows out the bottom is $57.0 billion of net income, a 31% margin. Growth was 3%. Scale is the product.
Fiscal 2025 also carried a one-off that ties the two charts on this page together. The fourth quarter absorbed a significant item from taking over the Apple Card portfolio, per the earnings release, the very book Goldman had just spent a year moving off its own balance sheet, and full-year earnings per share still came to $20.02. This morning's miss dents one quarter. It does not reshape a chart like this.
Open the interactive JPM chart →
---
Goldman Sachs Group Inc (GS), Fiscal 2025
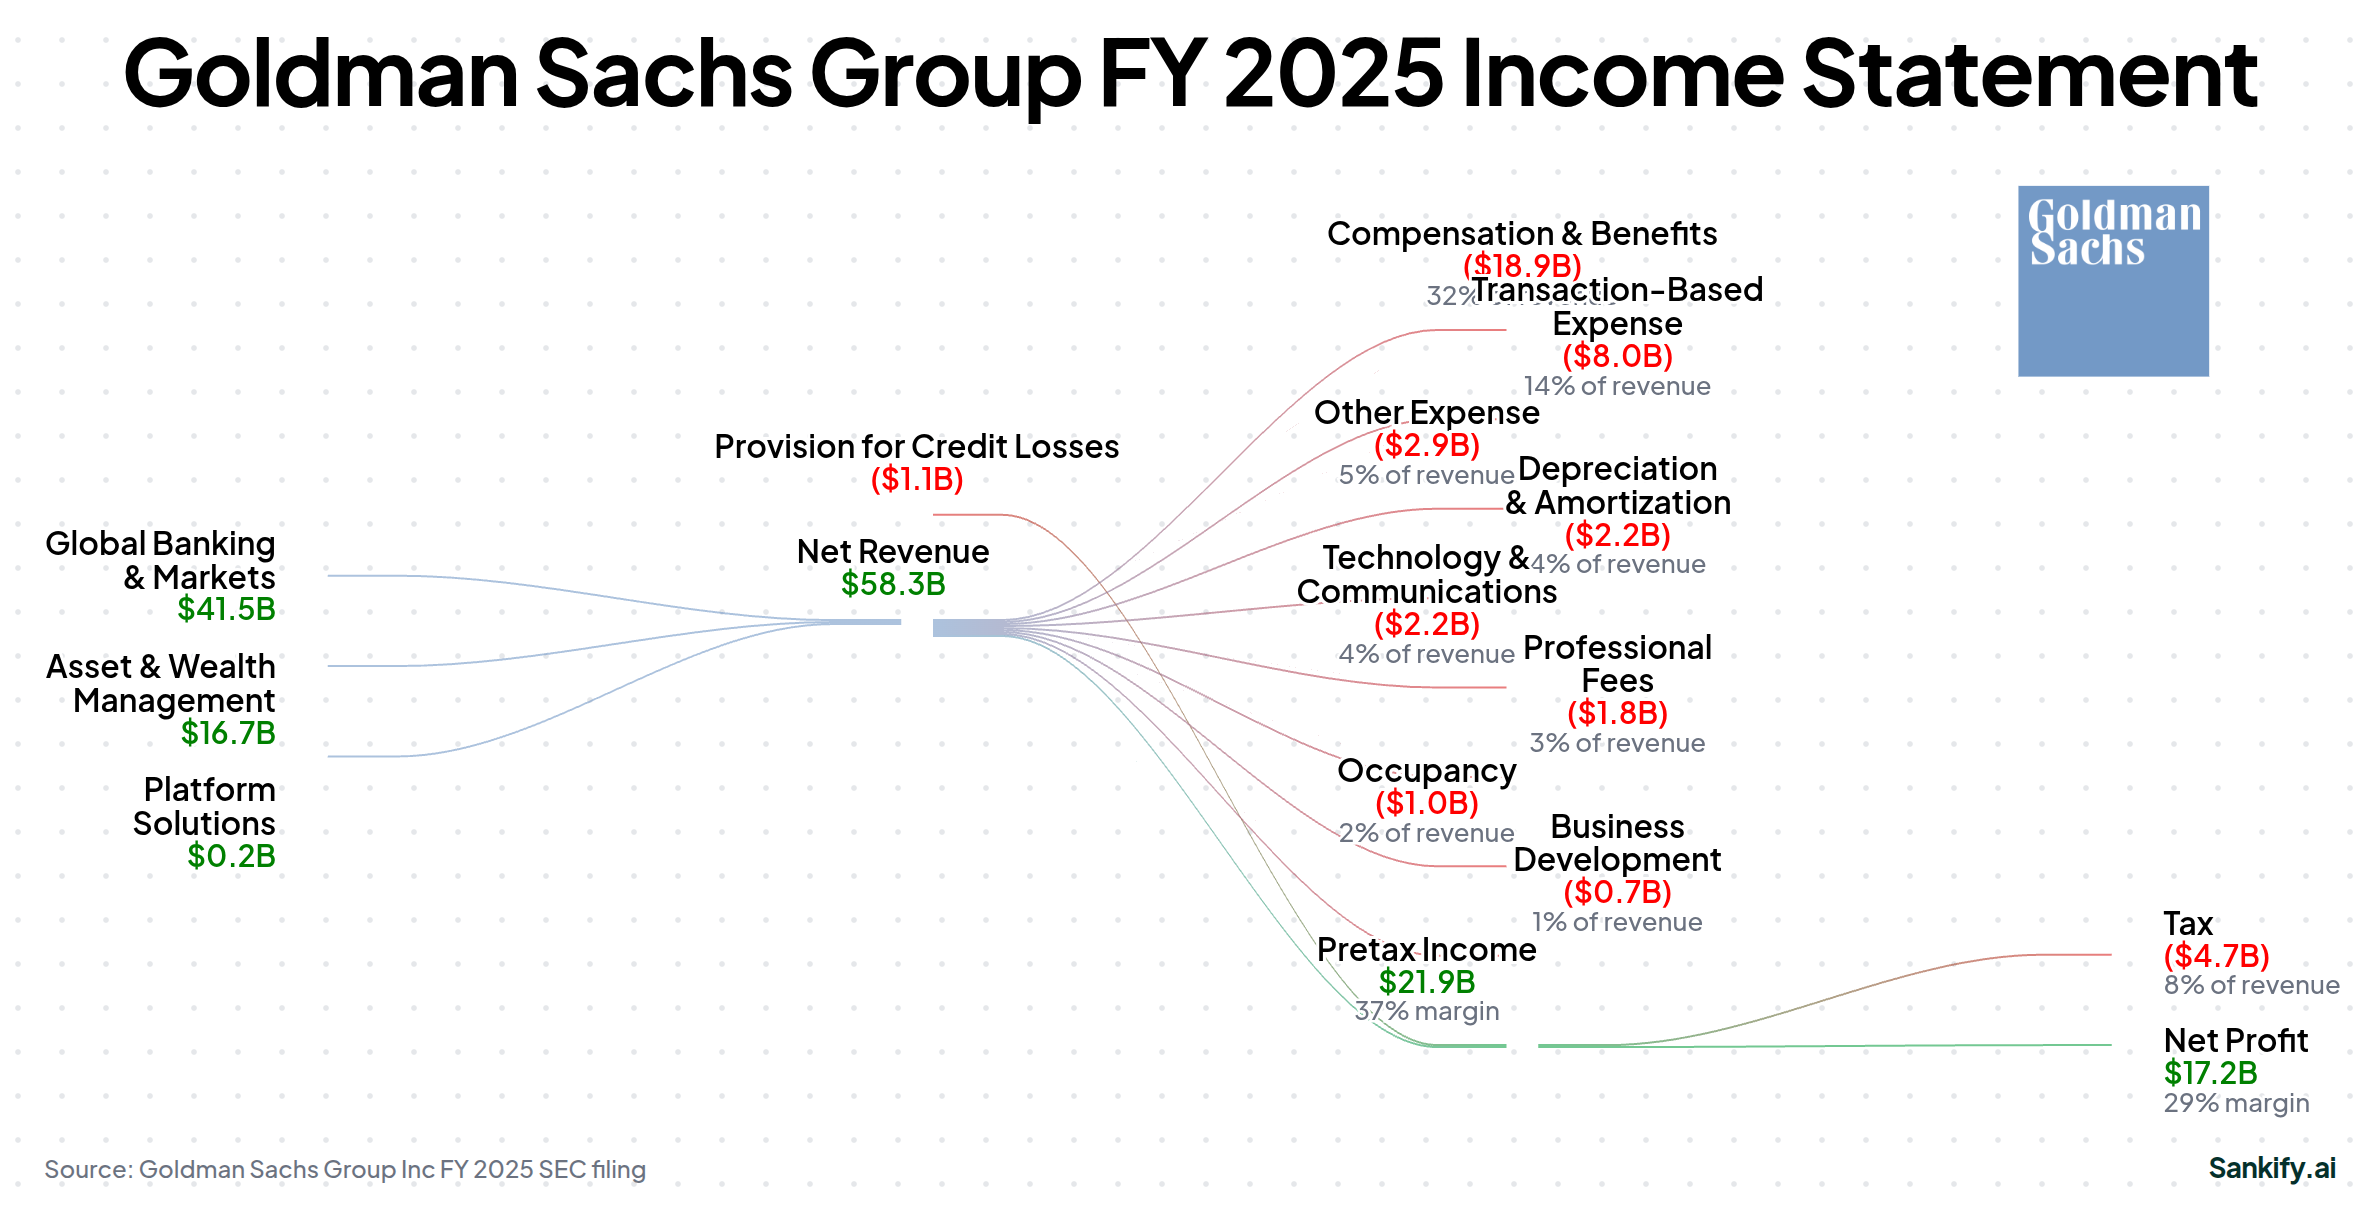
Goldman Sachs Group Inc's FY2025 revenue was $58.3B, up 9% year over year; net income $17.2B (29% margin).
Set against that, Goldman is a specialist. Net revenues of $58.3 billion in fiscal 2025 ran at roughly a third of JPMorgan's, grew 9%, and produced $17.2 billion of net earnings from trading desks and deal fees rather than deposits. The surprise is the margin. At 29%, it lands within two points of its diversified rival's, with return on equity for the year at 15%, per the earnings release.
The same year closed out Goldman's consumer experiment, with the Apple Card book sold across the street to JPMorgan, according to CNBC's coverage of the fourth-quarter results. Today showed the reconcentrated firm. Net revenues of $18.68 billion rose 23% from a year earlier, investment banking fees climbed 21% to $3.22 billion, and Global Banking & Markets alone produced $13.46 billion, per the earnings release, with annualized return on equity at 18.7%.
Open the interactive GS chart →
---
What this morning actually tested is the difference the two charts draw. Nearly identical net margins come out of almost opposite machines, one earning its 31 cents on the dollar across every consumer and corporate relationship in reach, the other earning 29 from whatever the deal cycle is doing that quarter. A specialist beats when the cycle runs hot and misses when it cools, and a giant mostly does neither. The split was the structure showing.
_Every chart on this page was rendered by Sankify from the company's own SEC filings. Nothing here is illustrative or mocked up._
See Financial Data Differently
Transform complex income statements into interactive Sankey diagrams. Understand where the money flows in seconds.
Try Sankify Free