Netflix, 2021 to 2025: The Crisis That Built the Margin Machine
Netflix's road from the 2022 subscriber shock to a 29% operating margin, drawn as five years of SEC-filed income statements and read on earnings day.
On the five charts below, Netflix looks healthier every single year. On this year's tape it looks like a problem, down about 26% on slowing growth and a string of guidance letdowns, according to Yahoo Finance's coverage ahead of tonight's third-quarter report. Both things are true. How they fit together is the story of the last five fiscal years.
---
NETFLIX INC (NFLX), Fiscal 2021
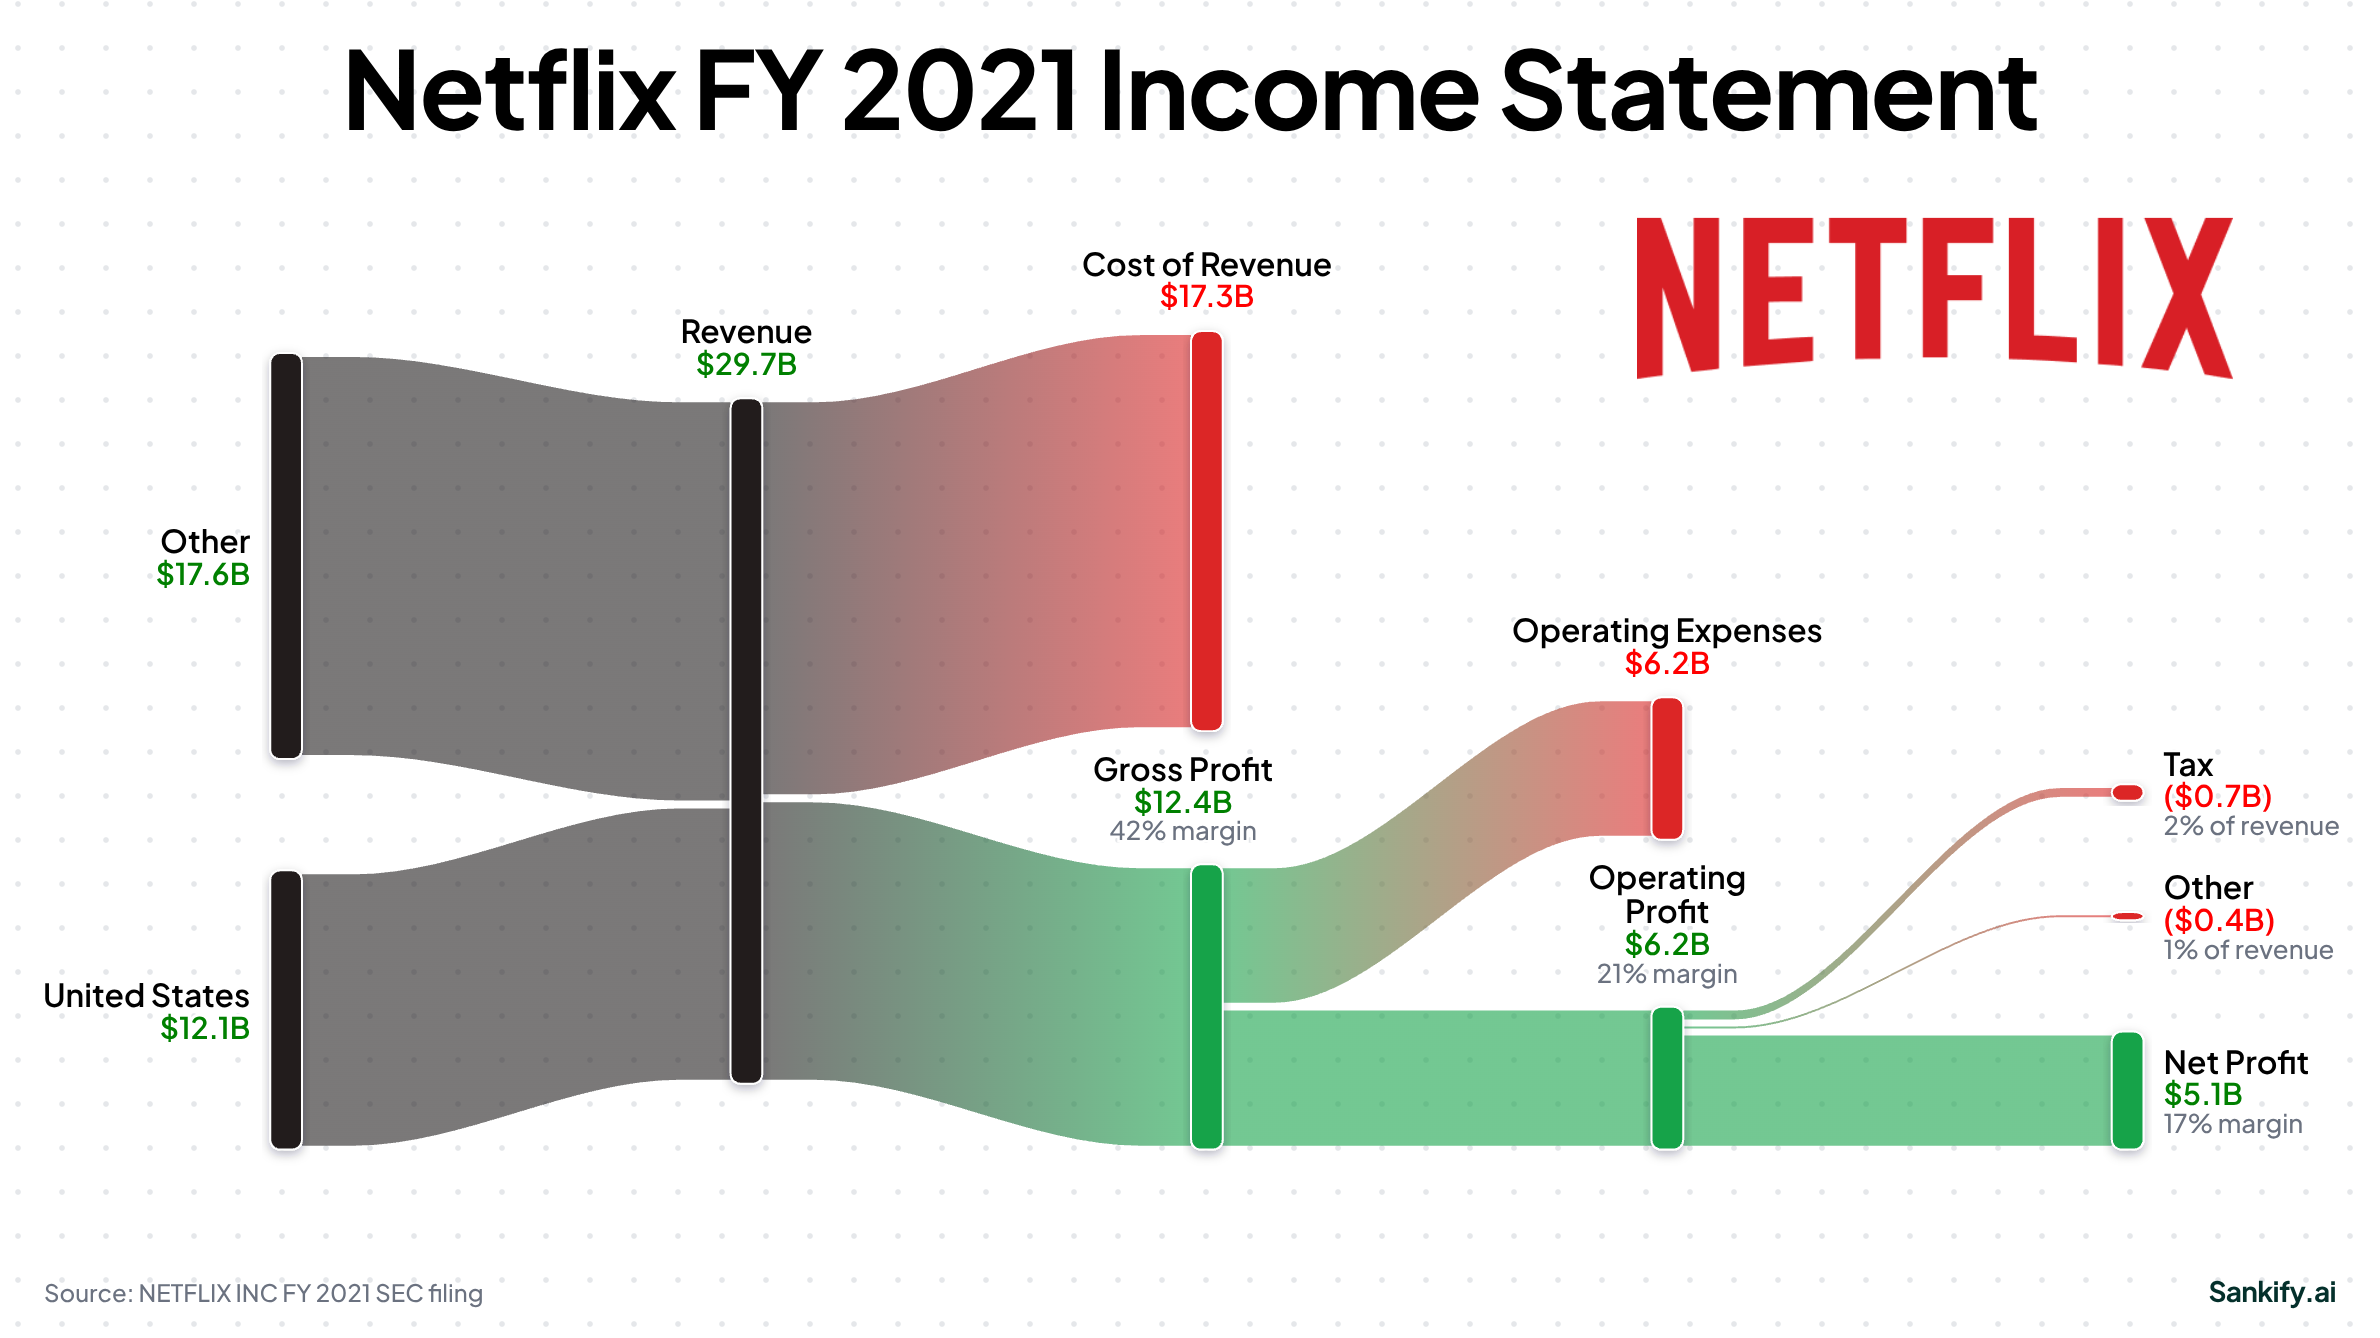
NETFLIX INC's FY2021 revenue was $29.7B, up 19% year over year; gross margin 42%; operating margin 21%; net income $5.1B (17% margin).
The pandemic built this chart and was already leaving it. Revenue grew 19% to $29.7 billion and the operating margin stood at 21%, numbers that look respectable here and would belong to a visibly different company within four years. Nothing in it hints at trouble. The trouble arrived four months into the next fiscal year.
Open the interactive NFLX chart →
---
NETFLIX INC (NFLX), Fiscal 2022
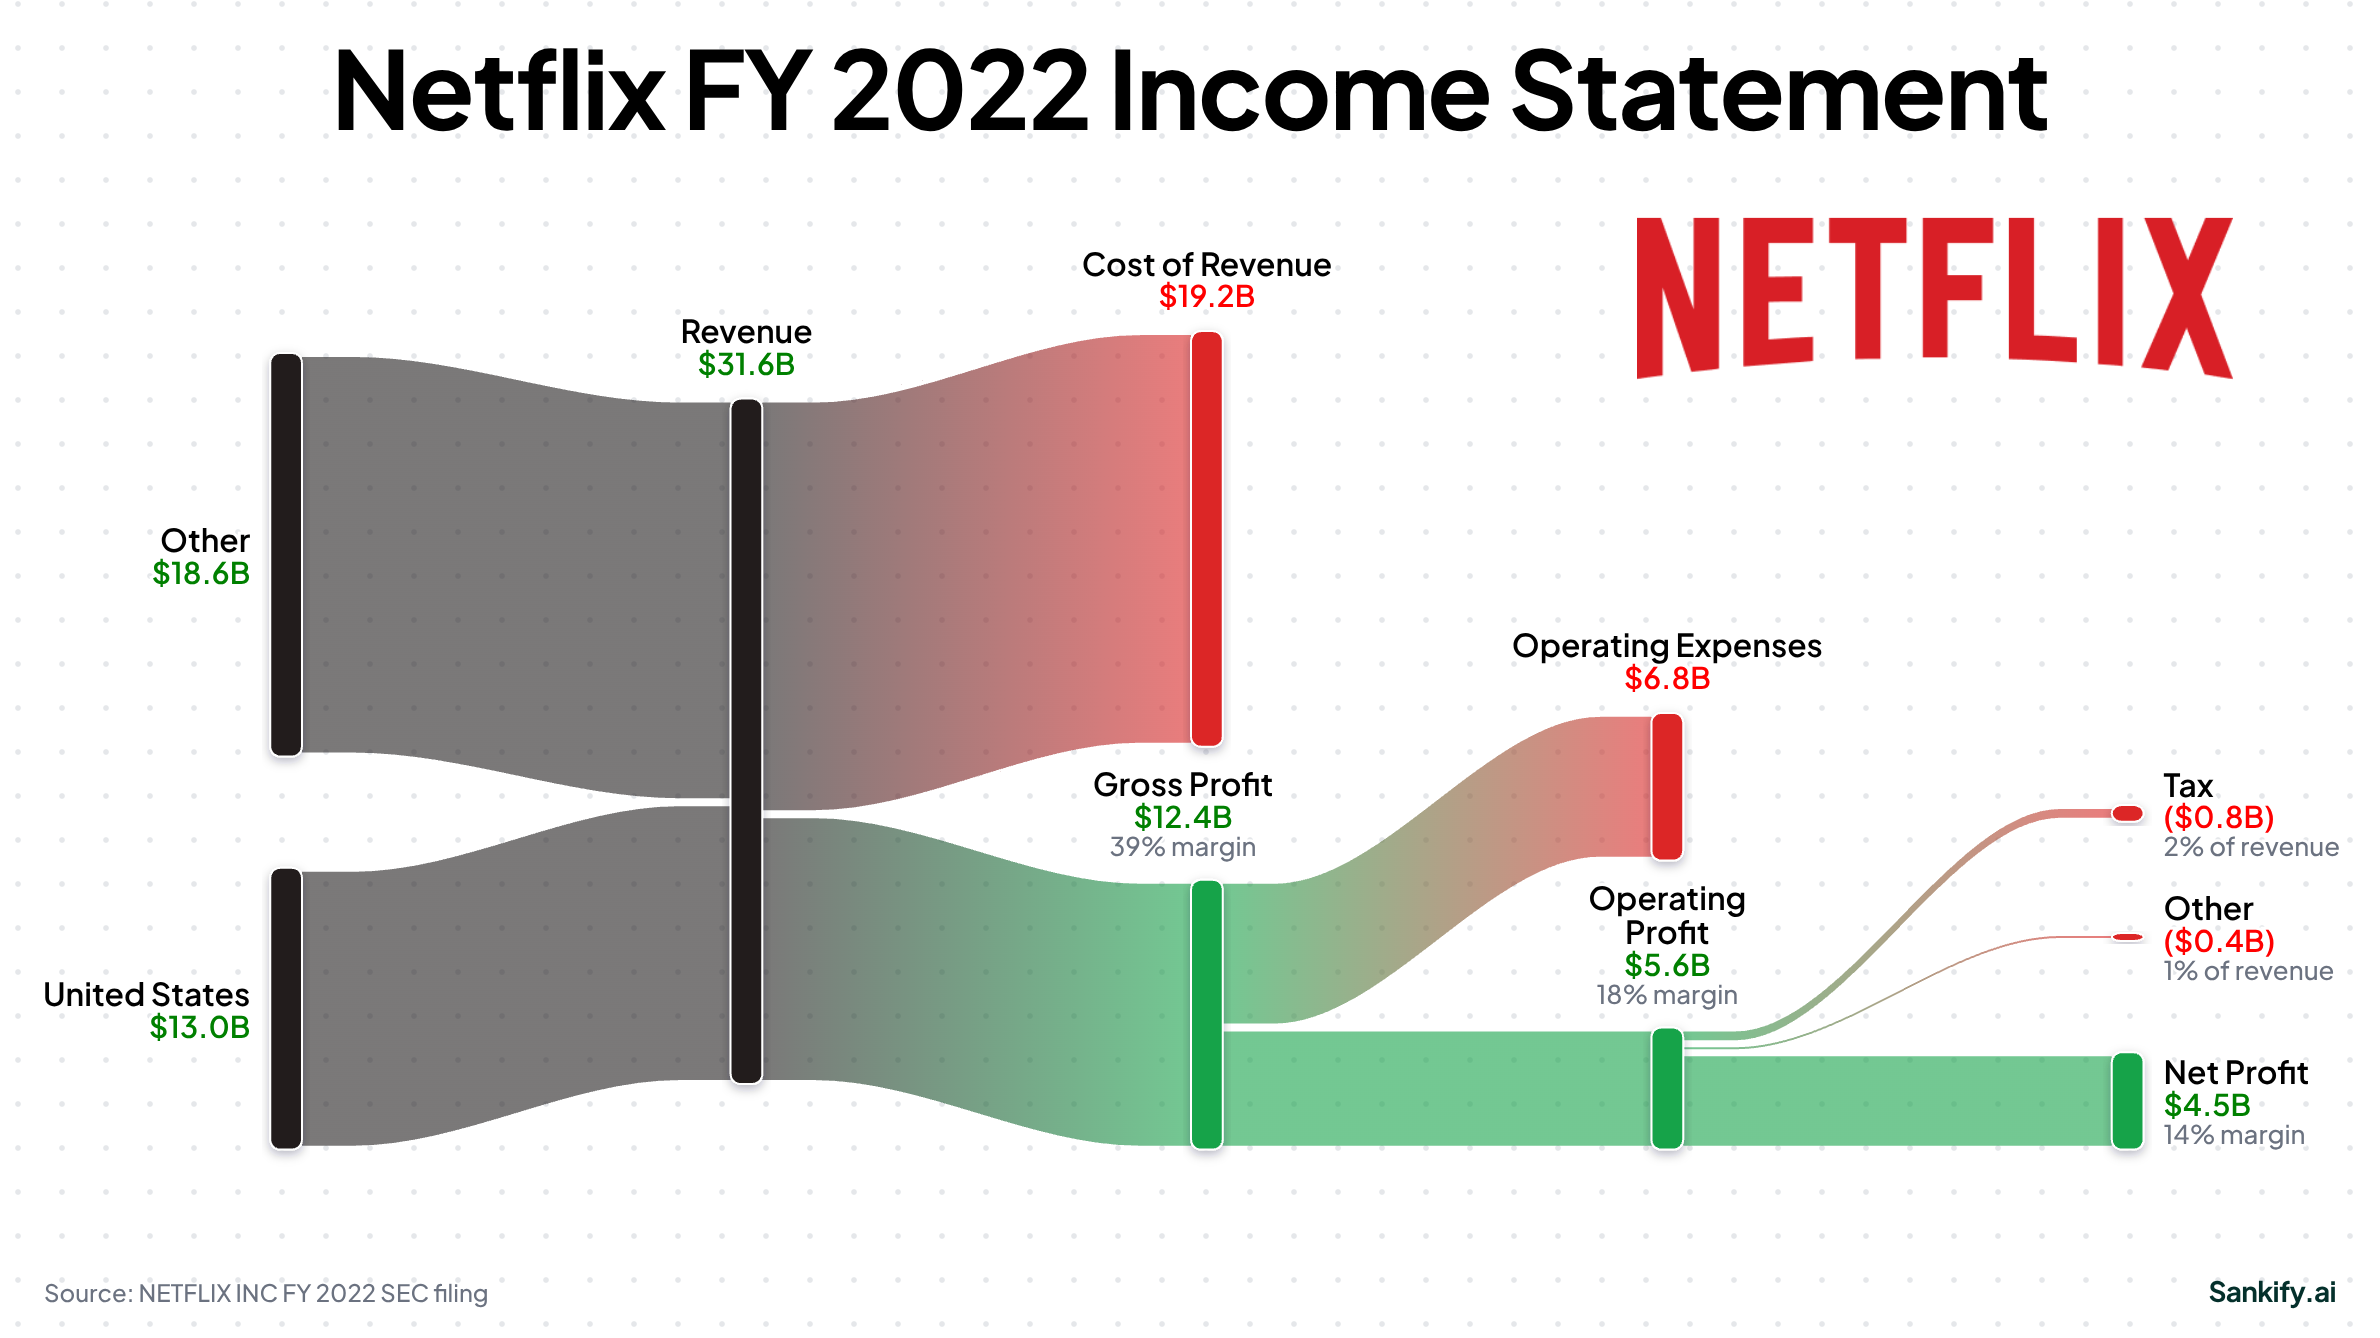
NETFLIX INC's FY2022 revenue was $31.6B, up 6% year over year; gross margin 39%; operating margin 18%; net income $4.5B (14% margin).
The crisis year is nearly invisible here, which is the strange part. Revenue still grew 6% and the operating margin only slipped to 18%, yet April of that year brought the first subscriber loss in more than a decade, 200,000 gone against an expected gain of 2.5 million, and the shares fell 35% in a day, erasing more than $50 billion of market value, according to CNBC's reporting at the time. The response became the whole next act. Reed Hastings, after years of resisting advertising, told investors the company would explore an ad-supported tier and a crackdown on the roughly 100 million households sharing passwords.
Open the interactive NFLX chart →
---
NETFLIX INC (NFLX), Fiscal 2023
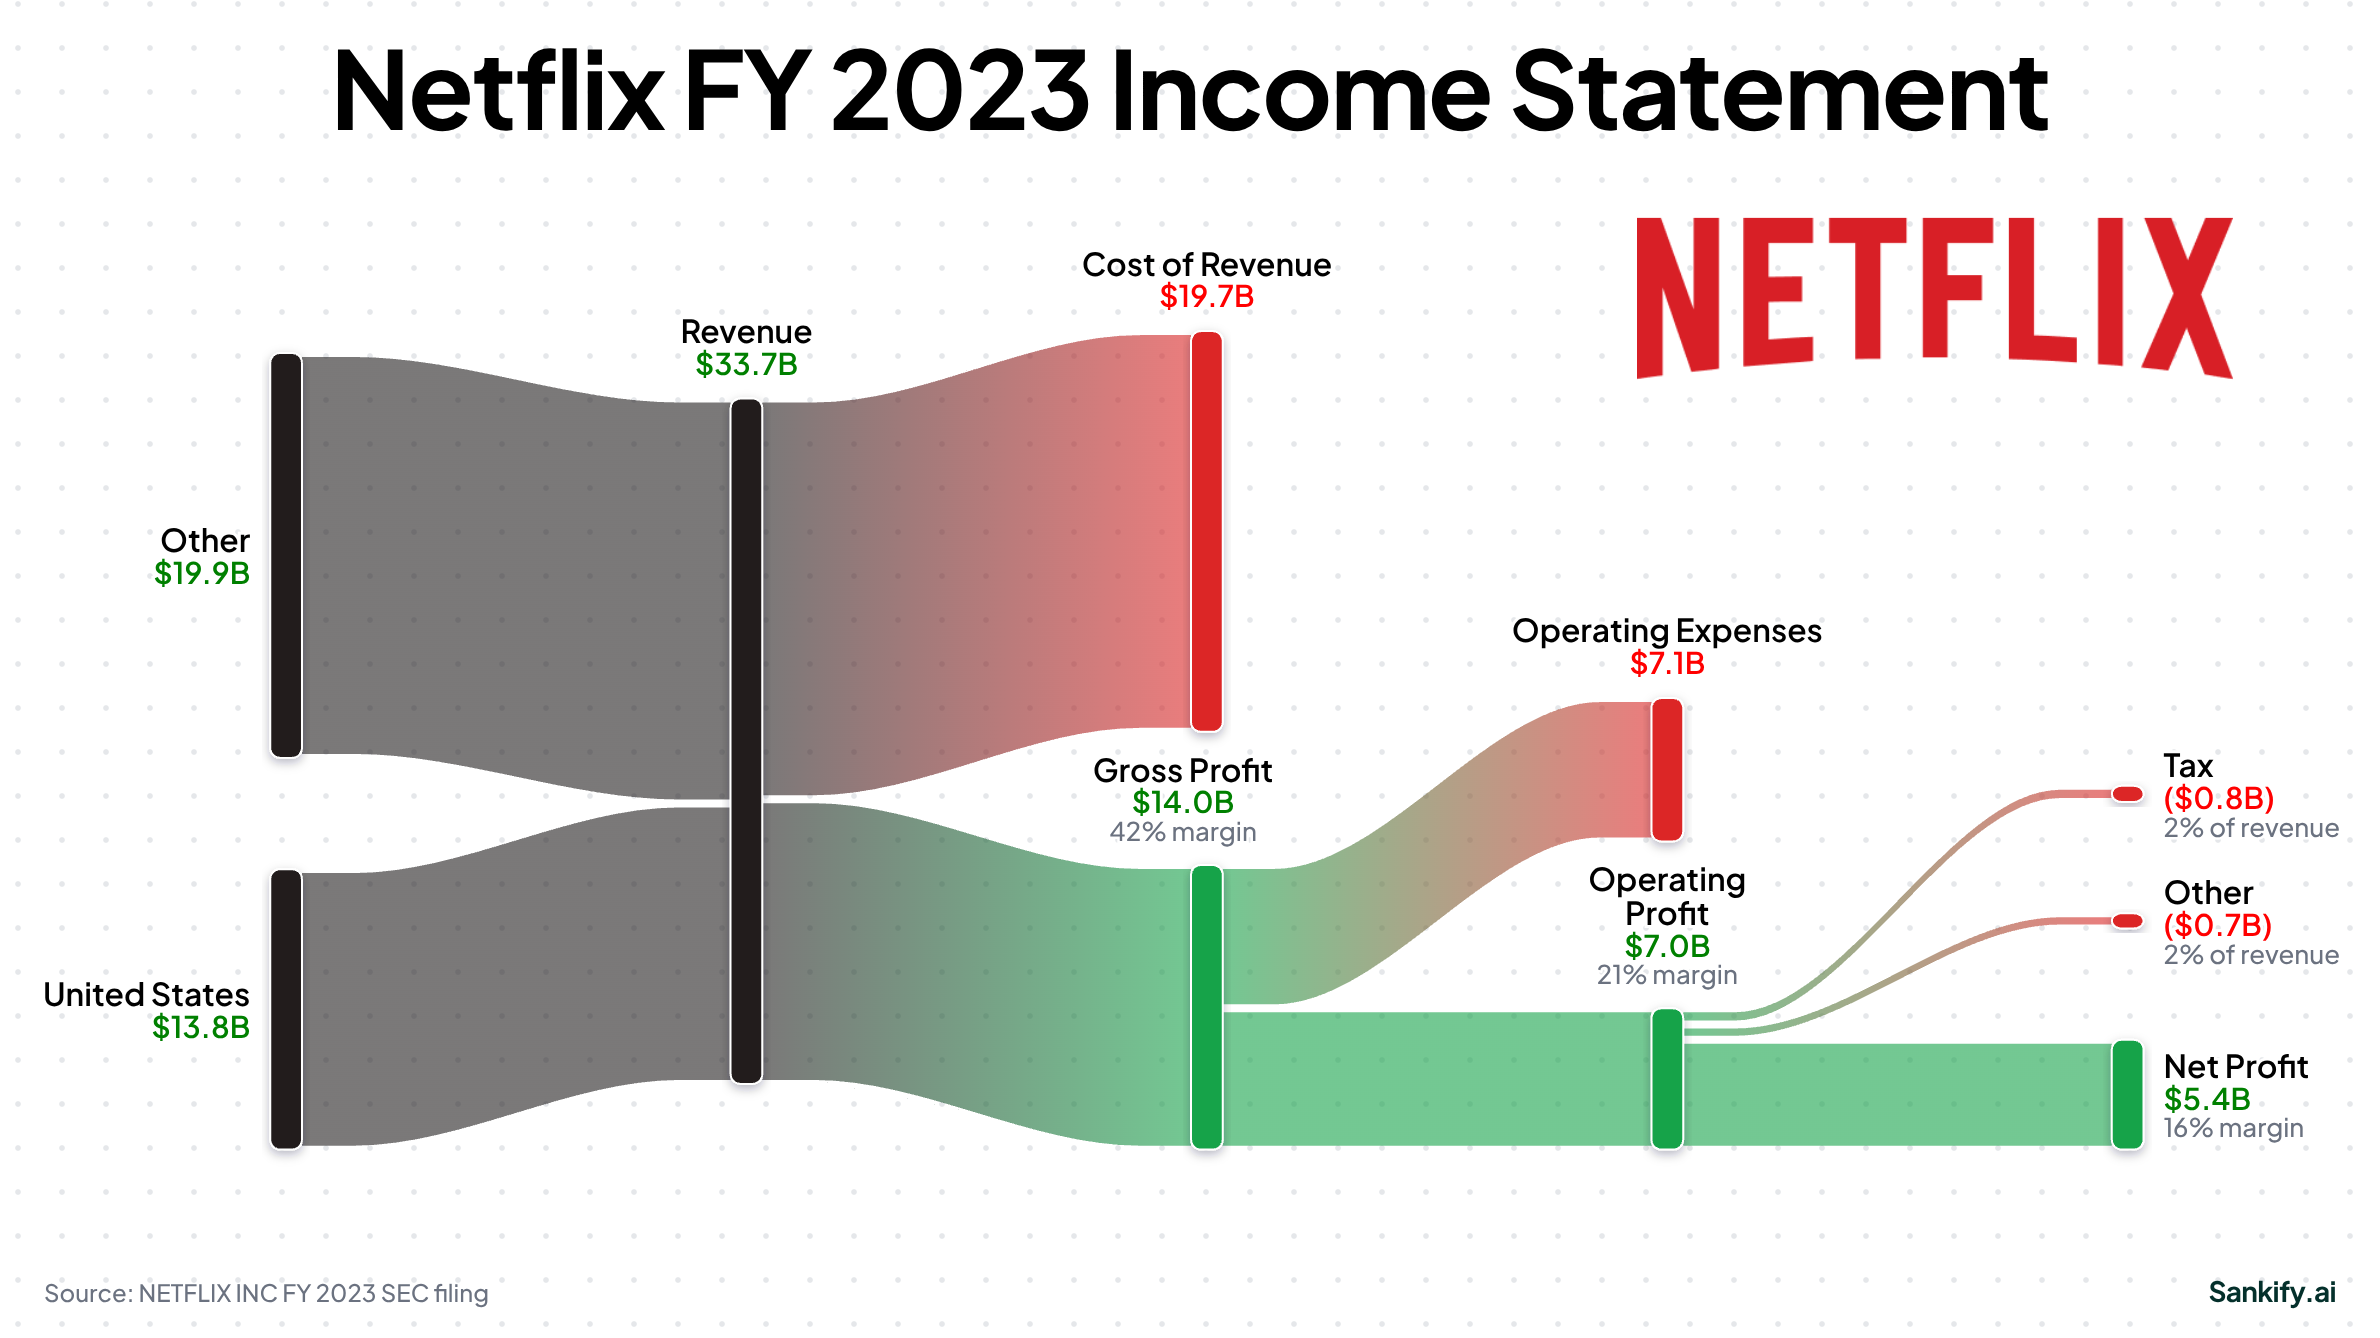
NETFLIX INC's FY2023 revenue was $33.7B, up 7% year over year; gross margin 42%; operating margin 21%; net income $5.4B (16% margin).
Recovery arrived dressed as another slow year. Growth was 7%, nearly the same as 2022, but the ad tier and the password crackdown announced in that April were both in the market by year end, as CNN and others reported at the time, and the operating margin had already turned back up to 21%. The shape of the chart moved less than the direction underneath it.
Open the interactive NFLX chart →
---
NETFLIX INC (NFLX), Fiscal 2024
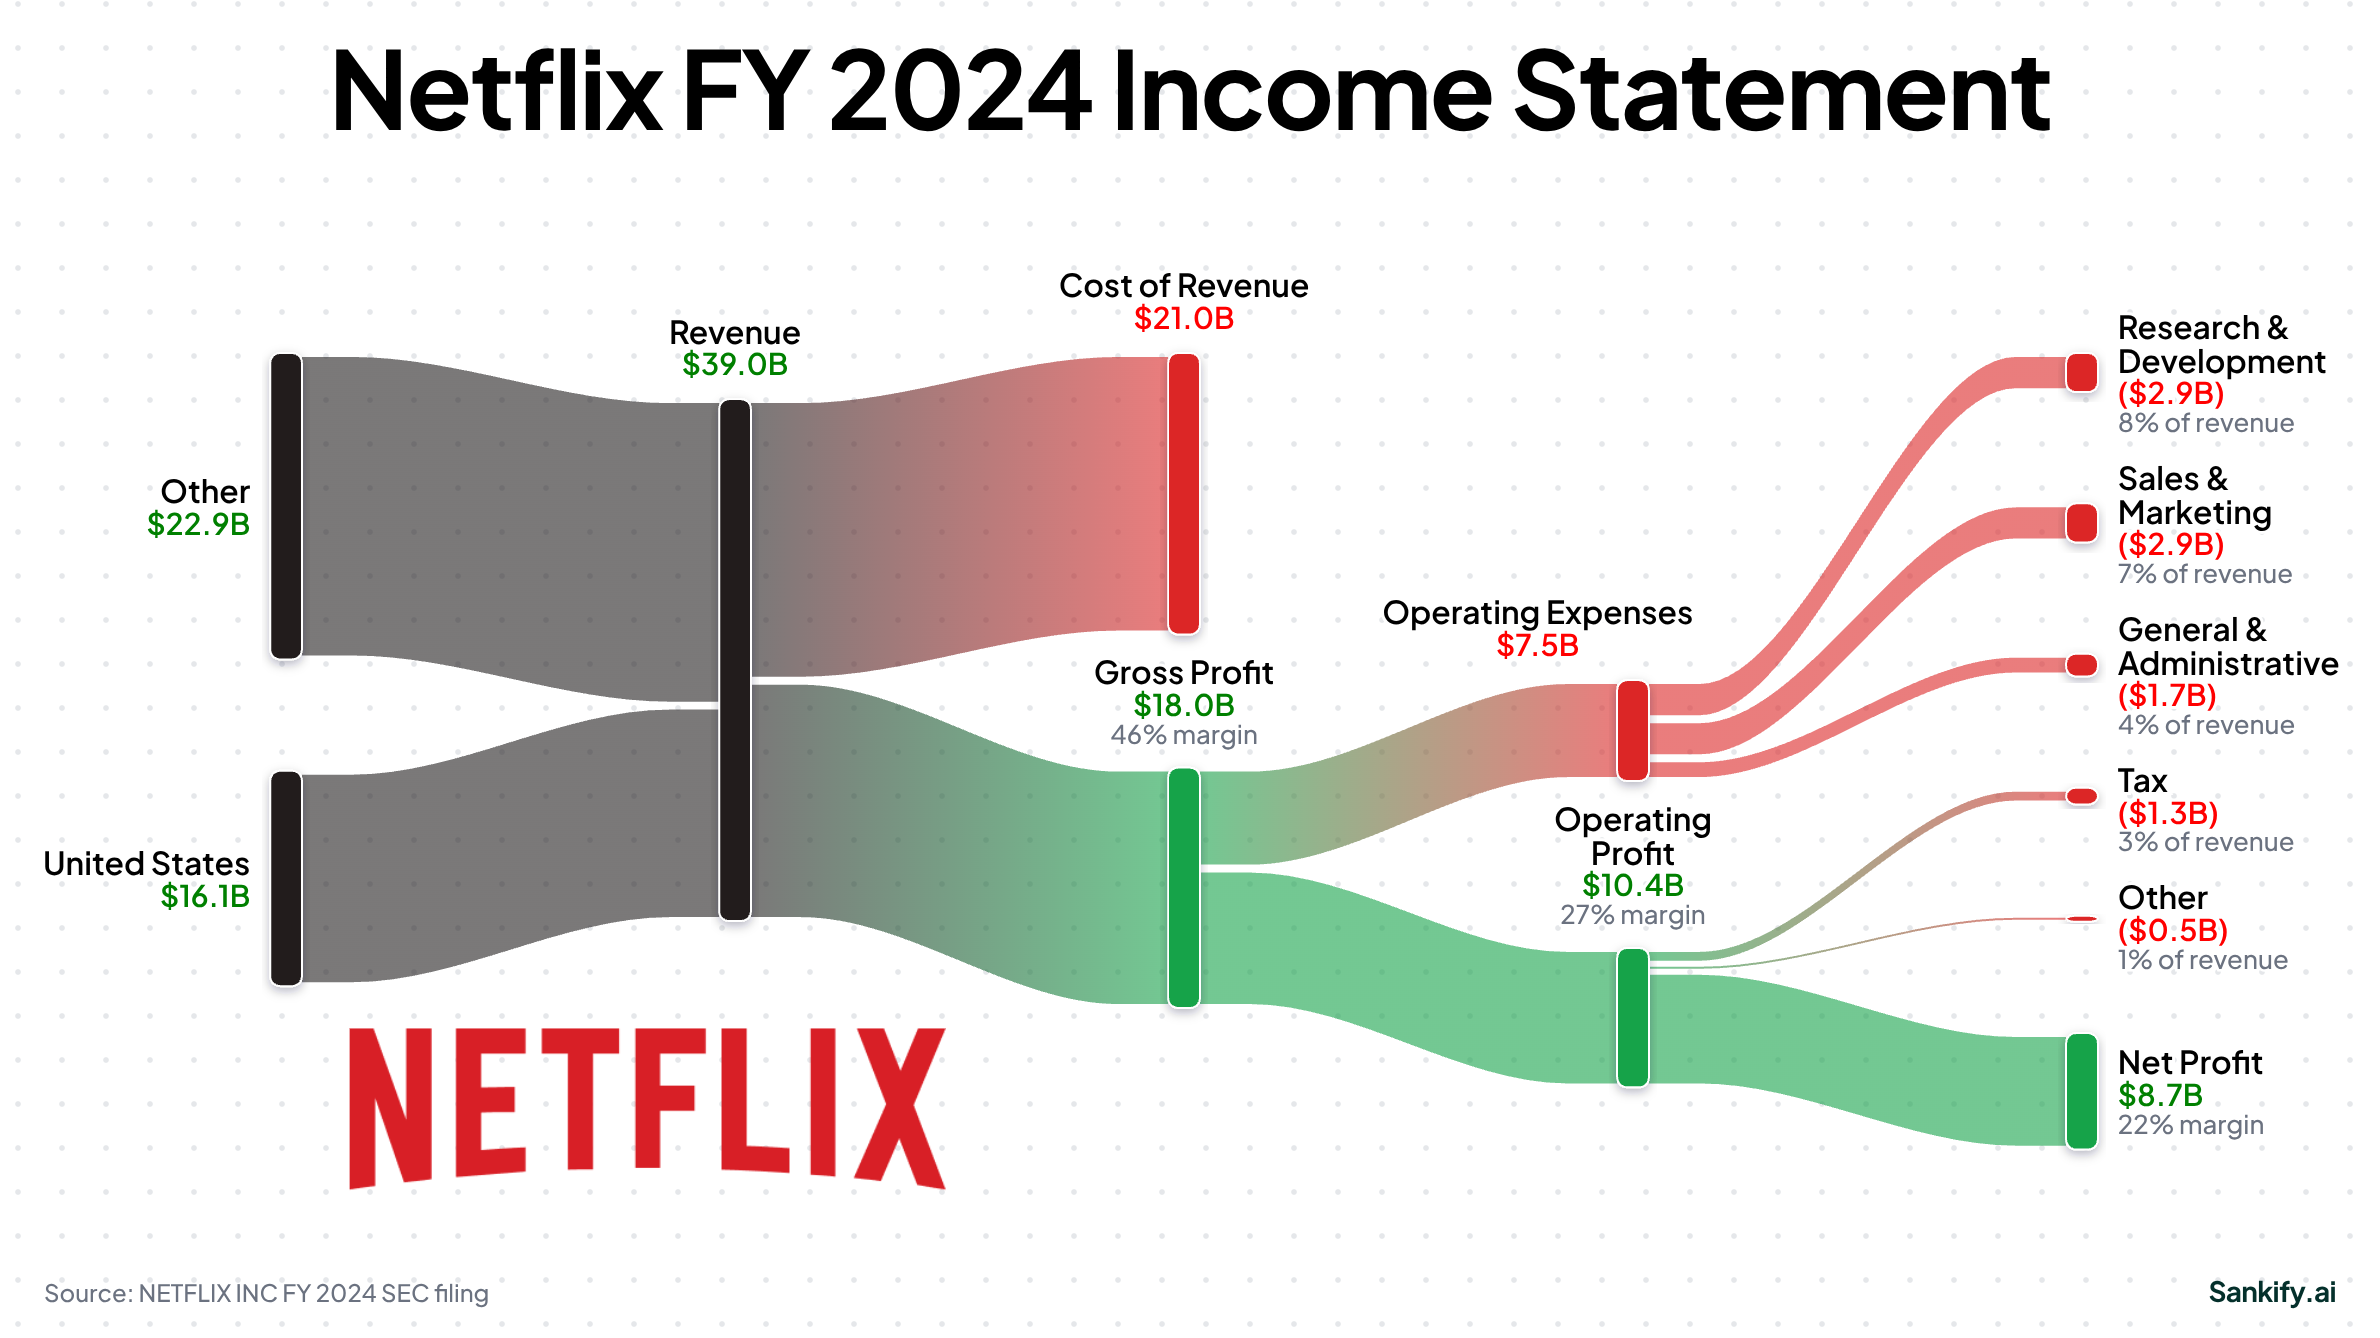
NETFLIX INC's FY2024 revenue was $39.0B, up 16% year over year; gross margin 46%; operating margin 27%; net income $8.7B (22% margin).
Fiscal 2024 is where the response showed up in the numbers. Revenue growth snapped back to 16%, the operating margin jumped six points to 27%, and net income reached $8.7 billion, up from $5.4 billion in the slow year immediately before. Gross margin rose four points. Costs simply grew slower than the top line.
Open the interactive NFLX chart →
---
NETFLIX INC (NFLX), Fiscal 2025
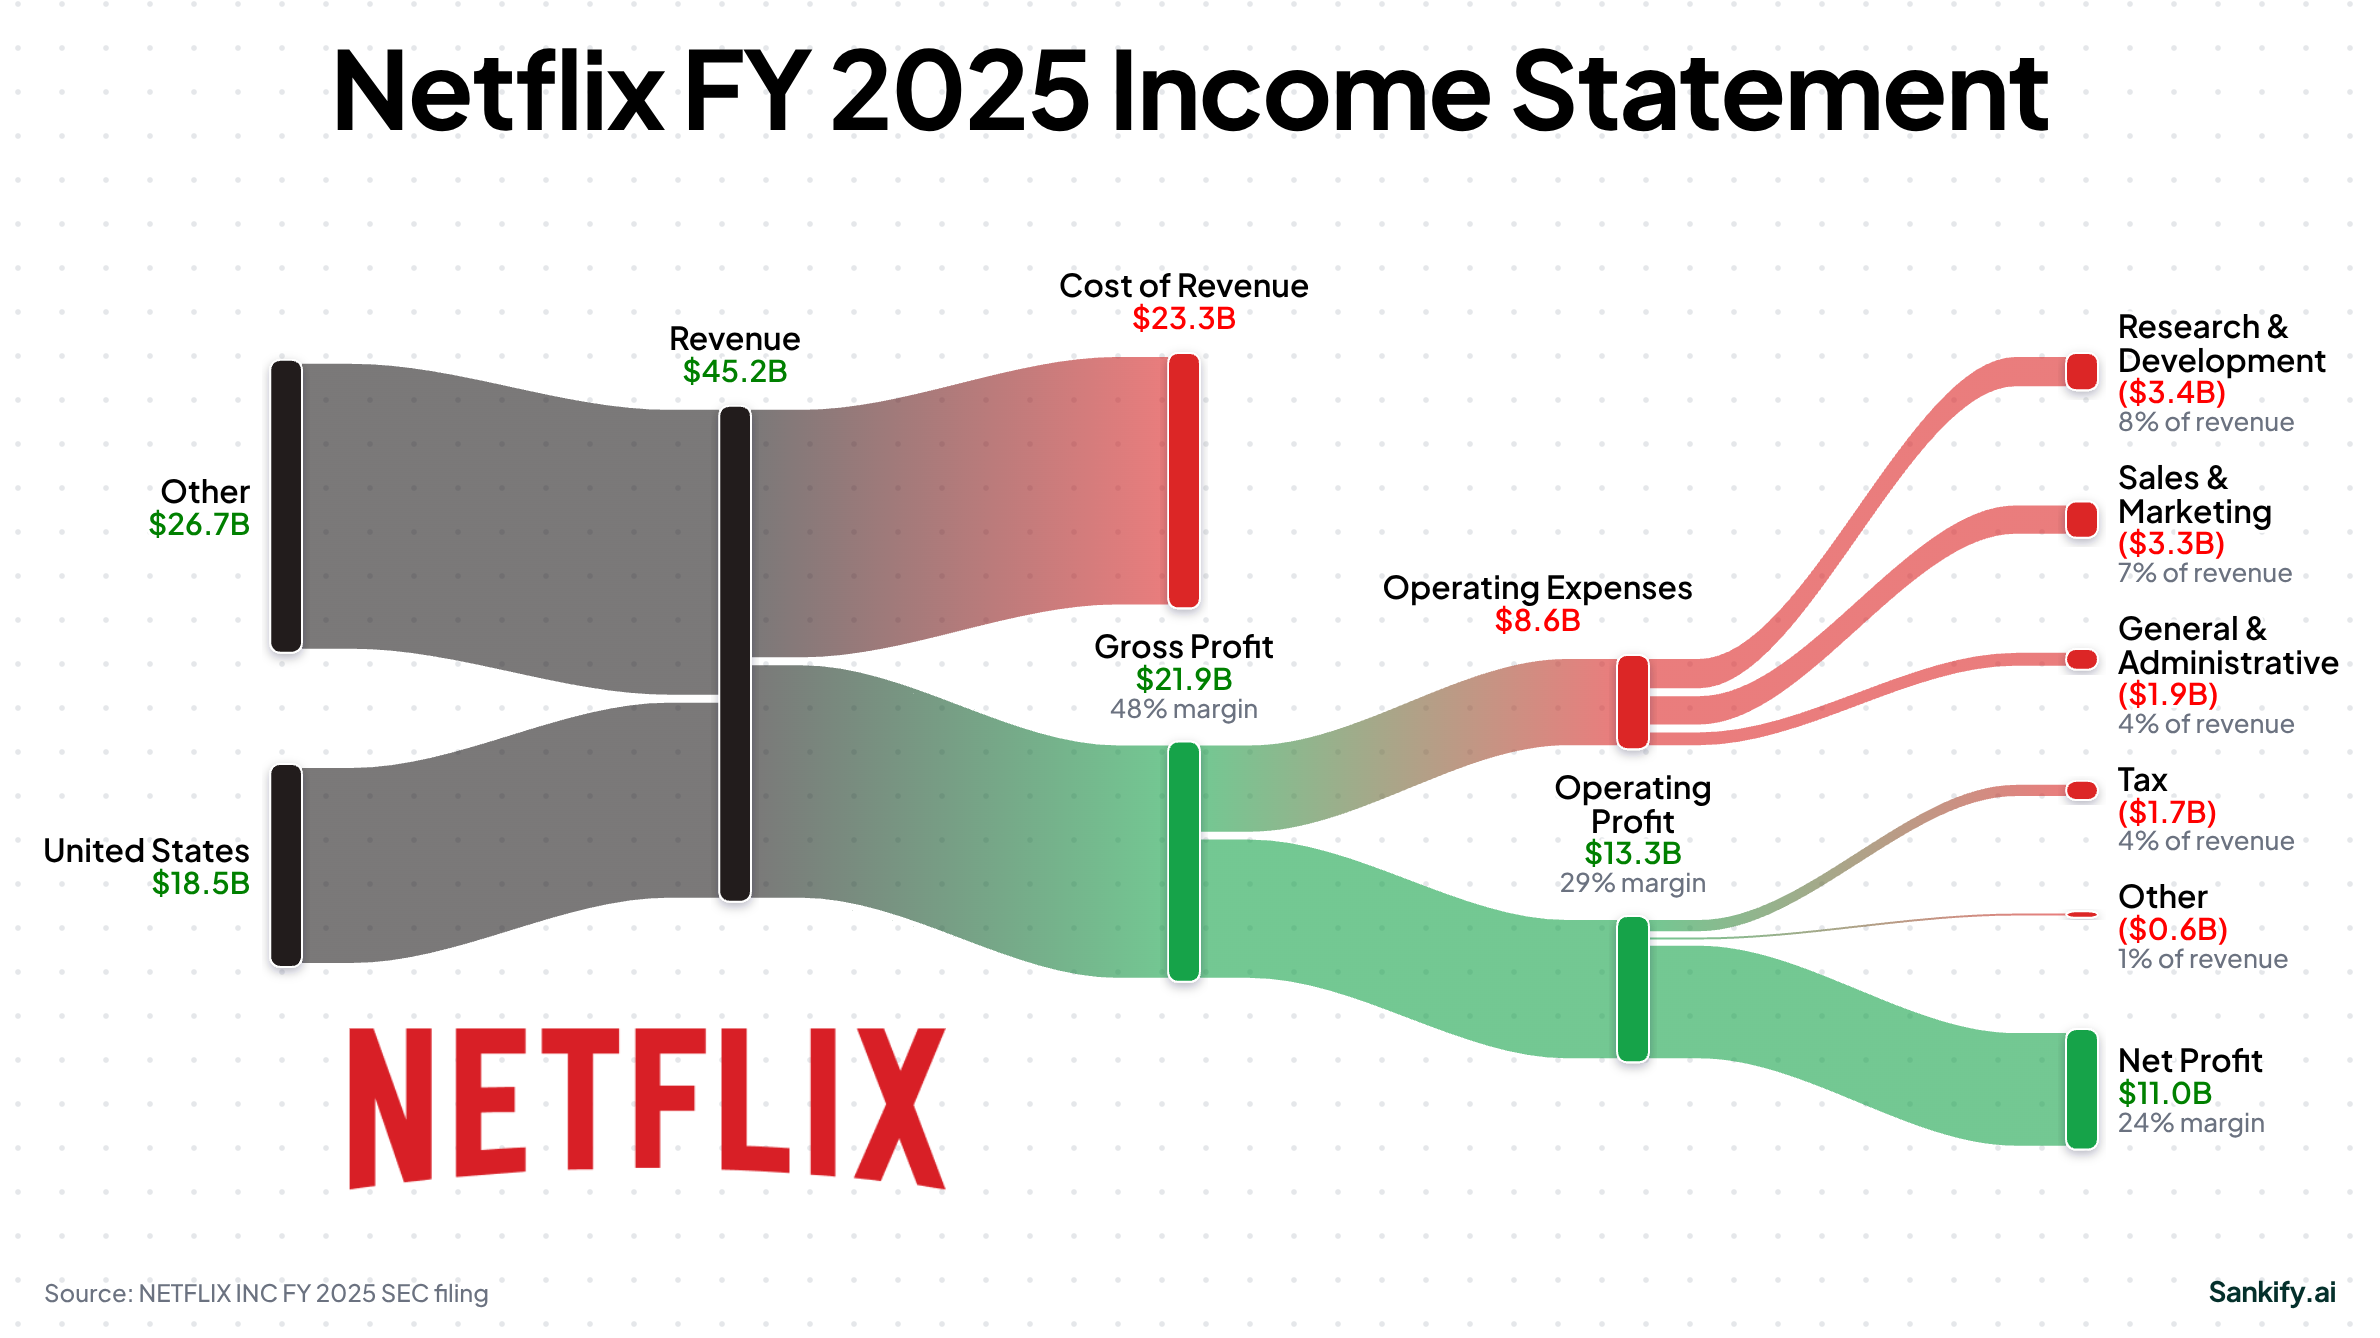
NETFLIX INC's FY2025 revenue was $45.2B, up 16% year over year; gross margin 48%; operating margin 29%; net income $11.0B (24% margin).
The best year came last. Revenue reached $45.2 billion, up 16% again, the operating margin hit 29%, and net income of $11.0 billion came in at more than double 2021's. Advertising revenue passed $1.5 billion, more than two and a half times the 2024 level, the company said, and guidance calls for a 31.5% operating margin in 2026 on revenue between $50.7 billion and $51.7 billion, with advertising expected to double again. One blemish sat in the third quarter, a $619 million charge to settle a Brazilian tax dispute, according to Investing.com's coverage of that report.
Open the interactive NFLX chart →
---
The five charts answer a question nobody is asking tonight, which is whether the 2022 playbook worked. The margins say it did. What the market wants to know, with the stock down a quarter this year, is what Netflix does for a third act once the password money is collected and the advertising line is merely doubling. On that, tonight's letter speaks and these charts stay quiet.
_Every chart on this page was rendered by Sankify from the company's own SEC filings. Nothing here is illustrative or mocked up._
See Financial Data Differently
Transform complex income statements into interactive Sankey diagrams. Understand where the money flows in seconds.
Try Sankify Free