Robinhood's Five-Year Rebuild, One Fiscal Year at a Time
Five fiscal years of Robinhood's own SEC filings, charted year by year, trace the path from a $3.7 billion IPO-year loss to a diversified, consistently profitable brokerage betting big on prediction markets and tokenization.
Robinhood went public in 2021. Its first year as a public company closed with a net loss of $3.69 billion, driven almost entirely by one-time charges tied to the IPO itself: a $2.05 billion fair-value swing on convertible notes and warrants, plus roughly $1.57 billion in share-based compensation, not the trading business underneath it, according to the company's Q4 2021 earnings release. The business itself grew. Five fiscal years later, chief executive Vlad Tenev told CNBC's Squawk Box on August 19, 2026 that tokenization is "the beginning of a supercycle" set to "take over the entire financial system." The five charts below, pulled from Robinhood's own 10-K filings, show what actually happened in between.
---
Robinhood Markets, Inc. (HOOD), Fiscal 2021
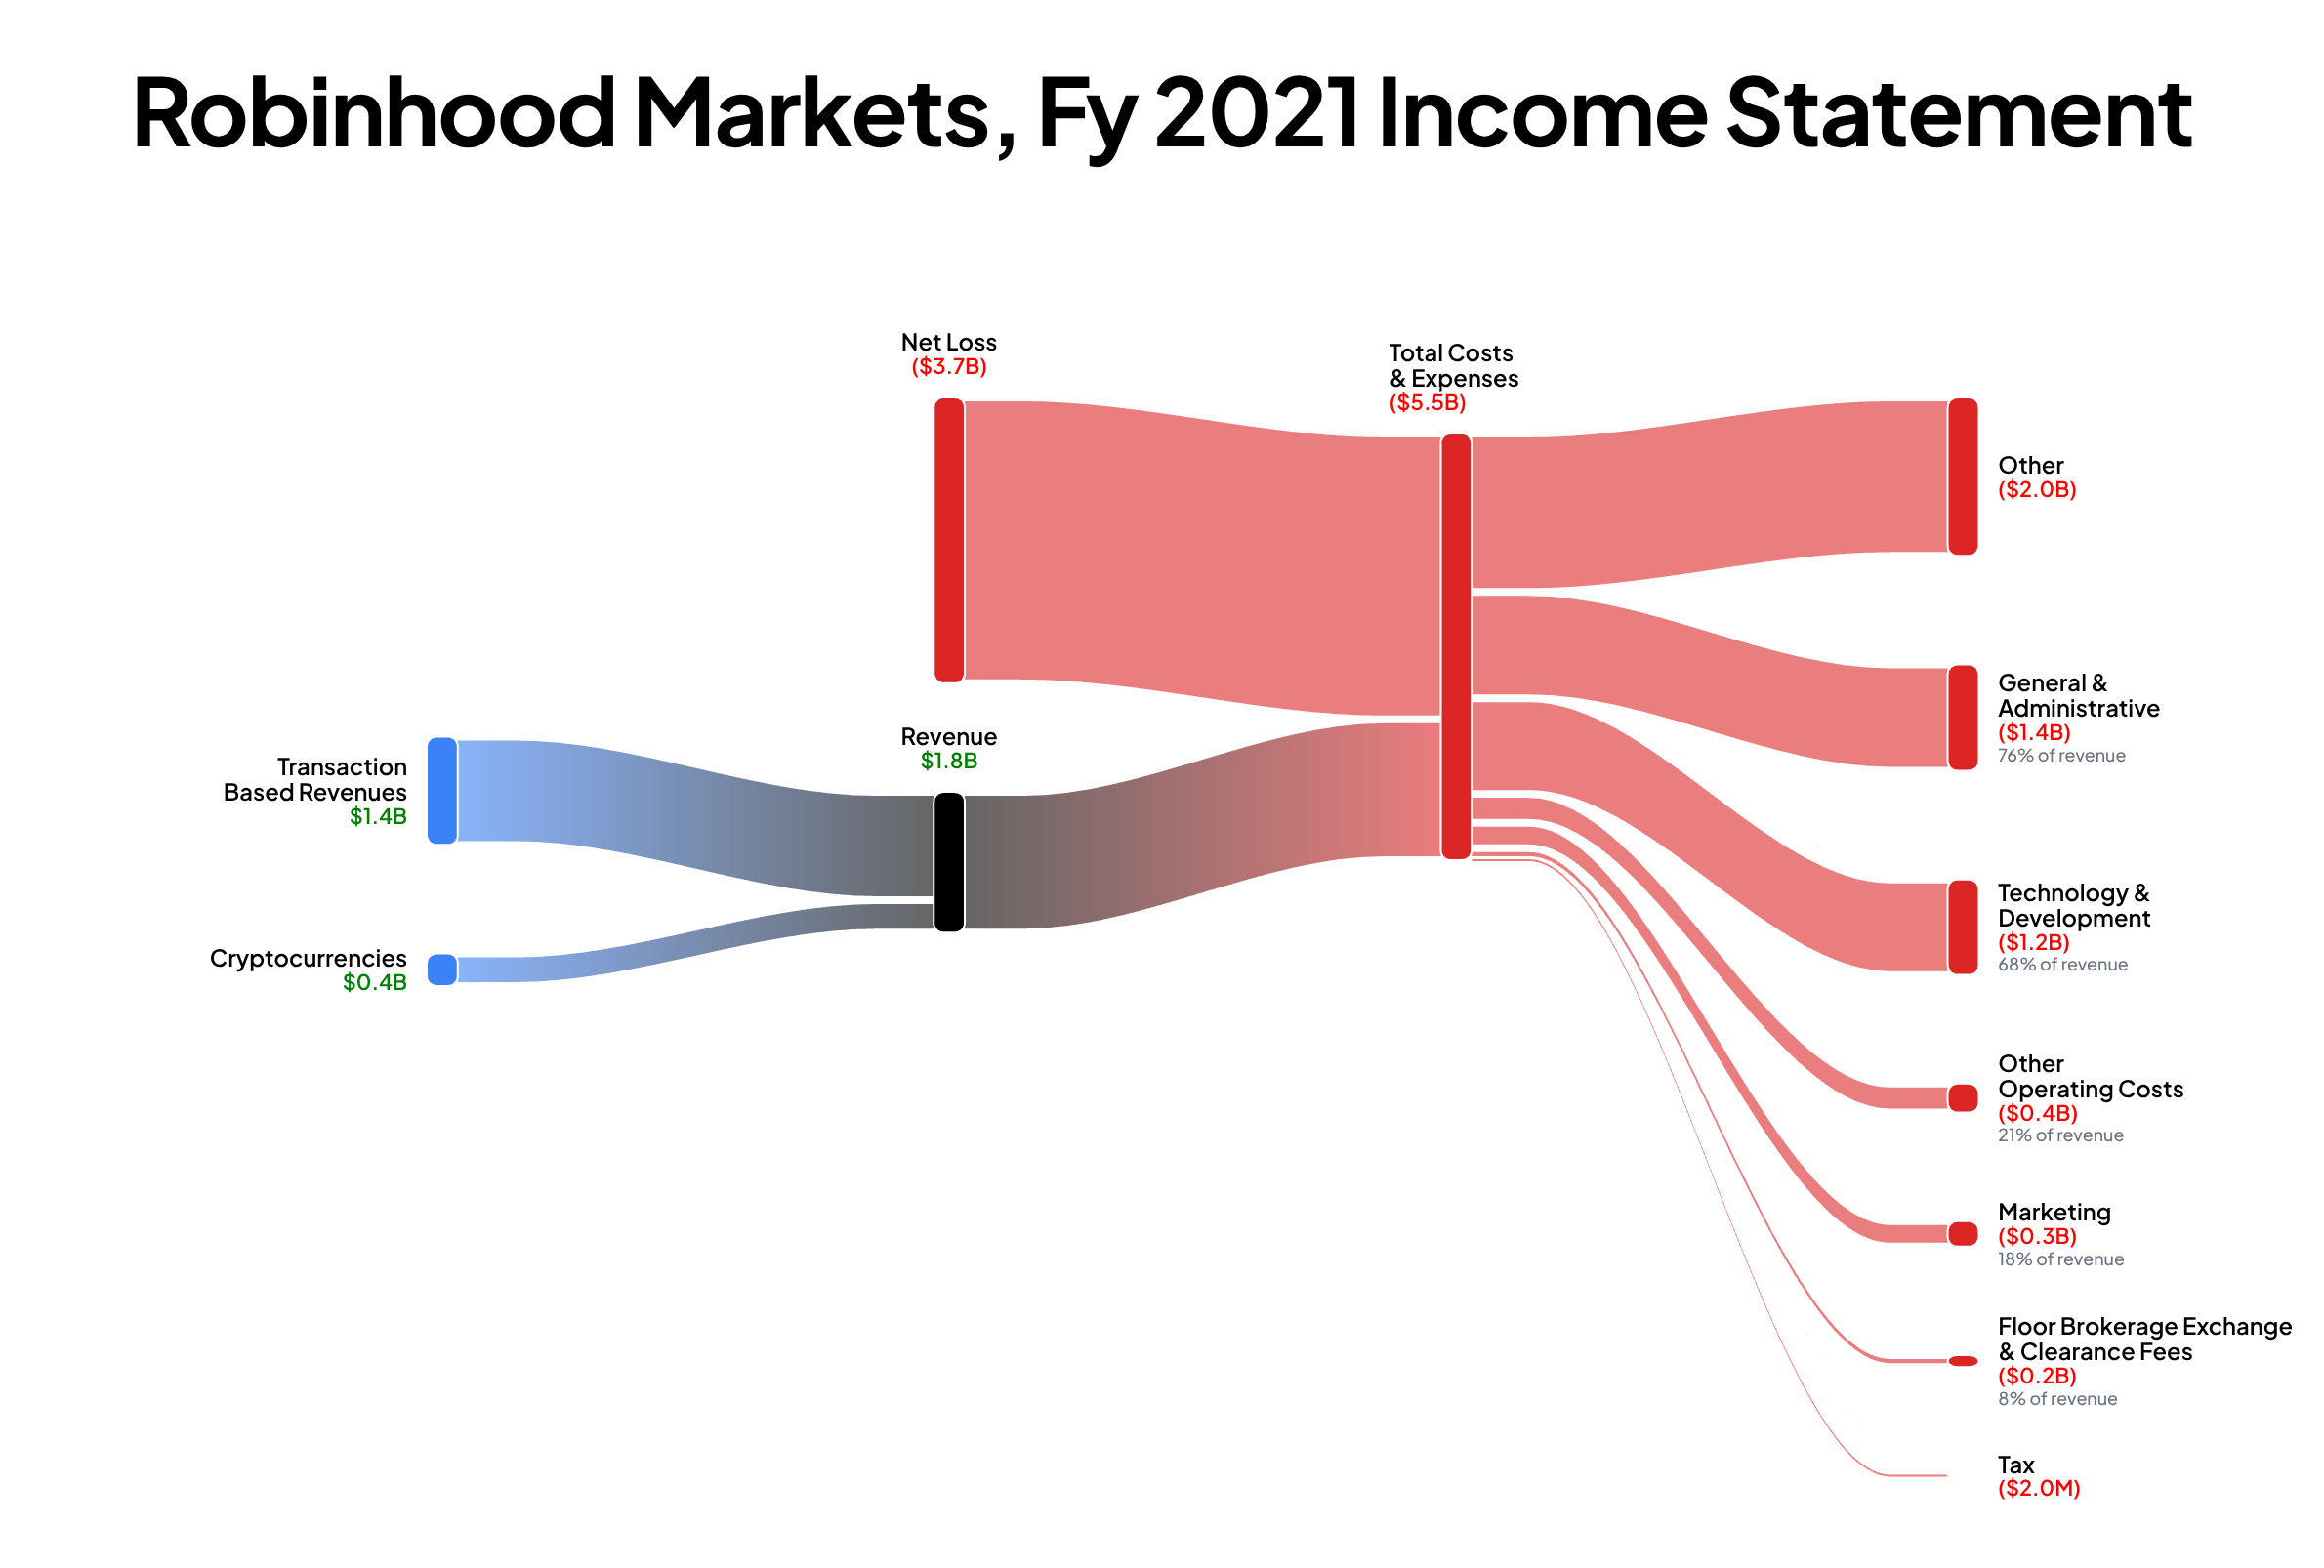
Robinhood Markets, Inc.'s FY2021 revenue was $1.8B, up 89% year over year; net income -$3.7B (-203% margin).
Fiscal 2021 is the outlier of this whole set. Revenue reached $1.8 billion, up 89% from 2020's retail-trading boom, the GameStop and AMC mania that made Robinhood a household name and, eventually, a subpoena target. None of it reached the bottom line. The $3.69 billion net loss was a paper one: Robinhood's 10-K attributes $2.05 billion of it to the change in fair value of convertible notes and warrants issued just before the IPO, plus a one-time $1.037 billion charge when restricted stock units vested on the listing date, according to the company's Q4 2021 earnings release. Strip those two items out and 2021 looks close to break-even on an operating basis.
Open the interactive HOOD chart →
---
Robinhood Markets, Inc. (HOOD), Fiscal 2022
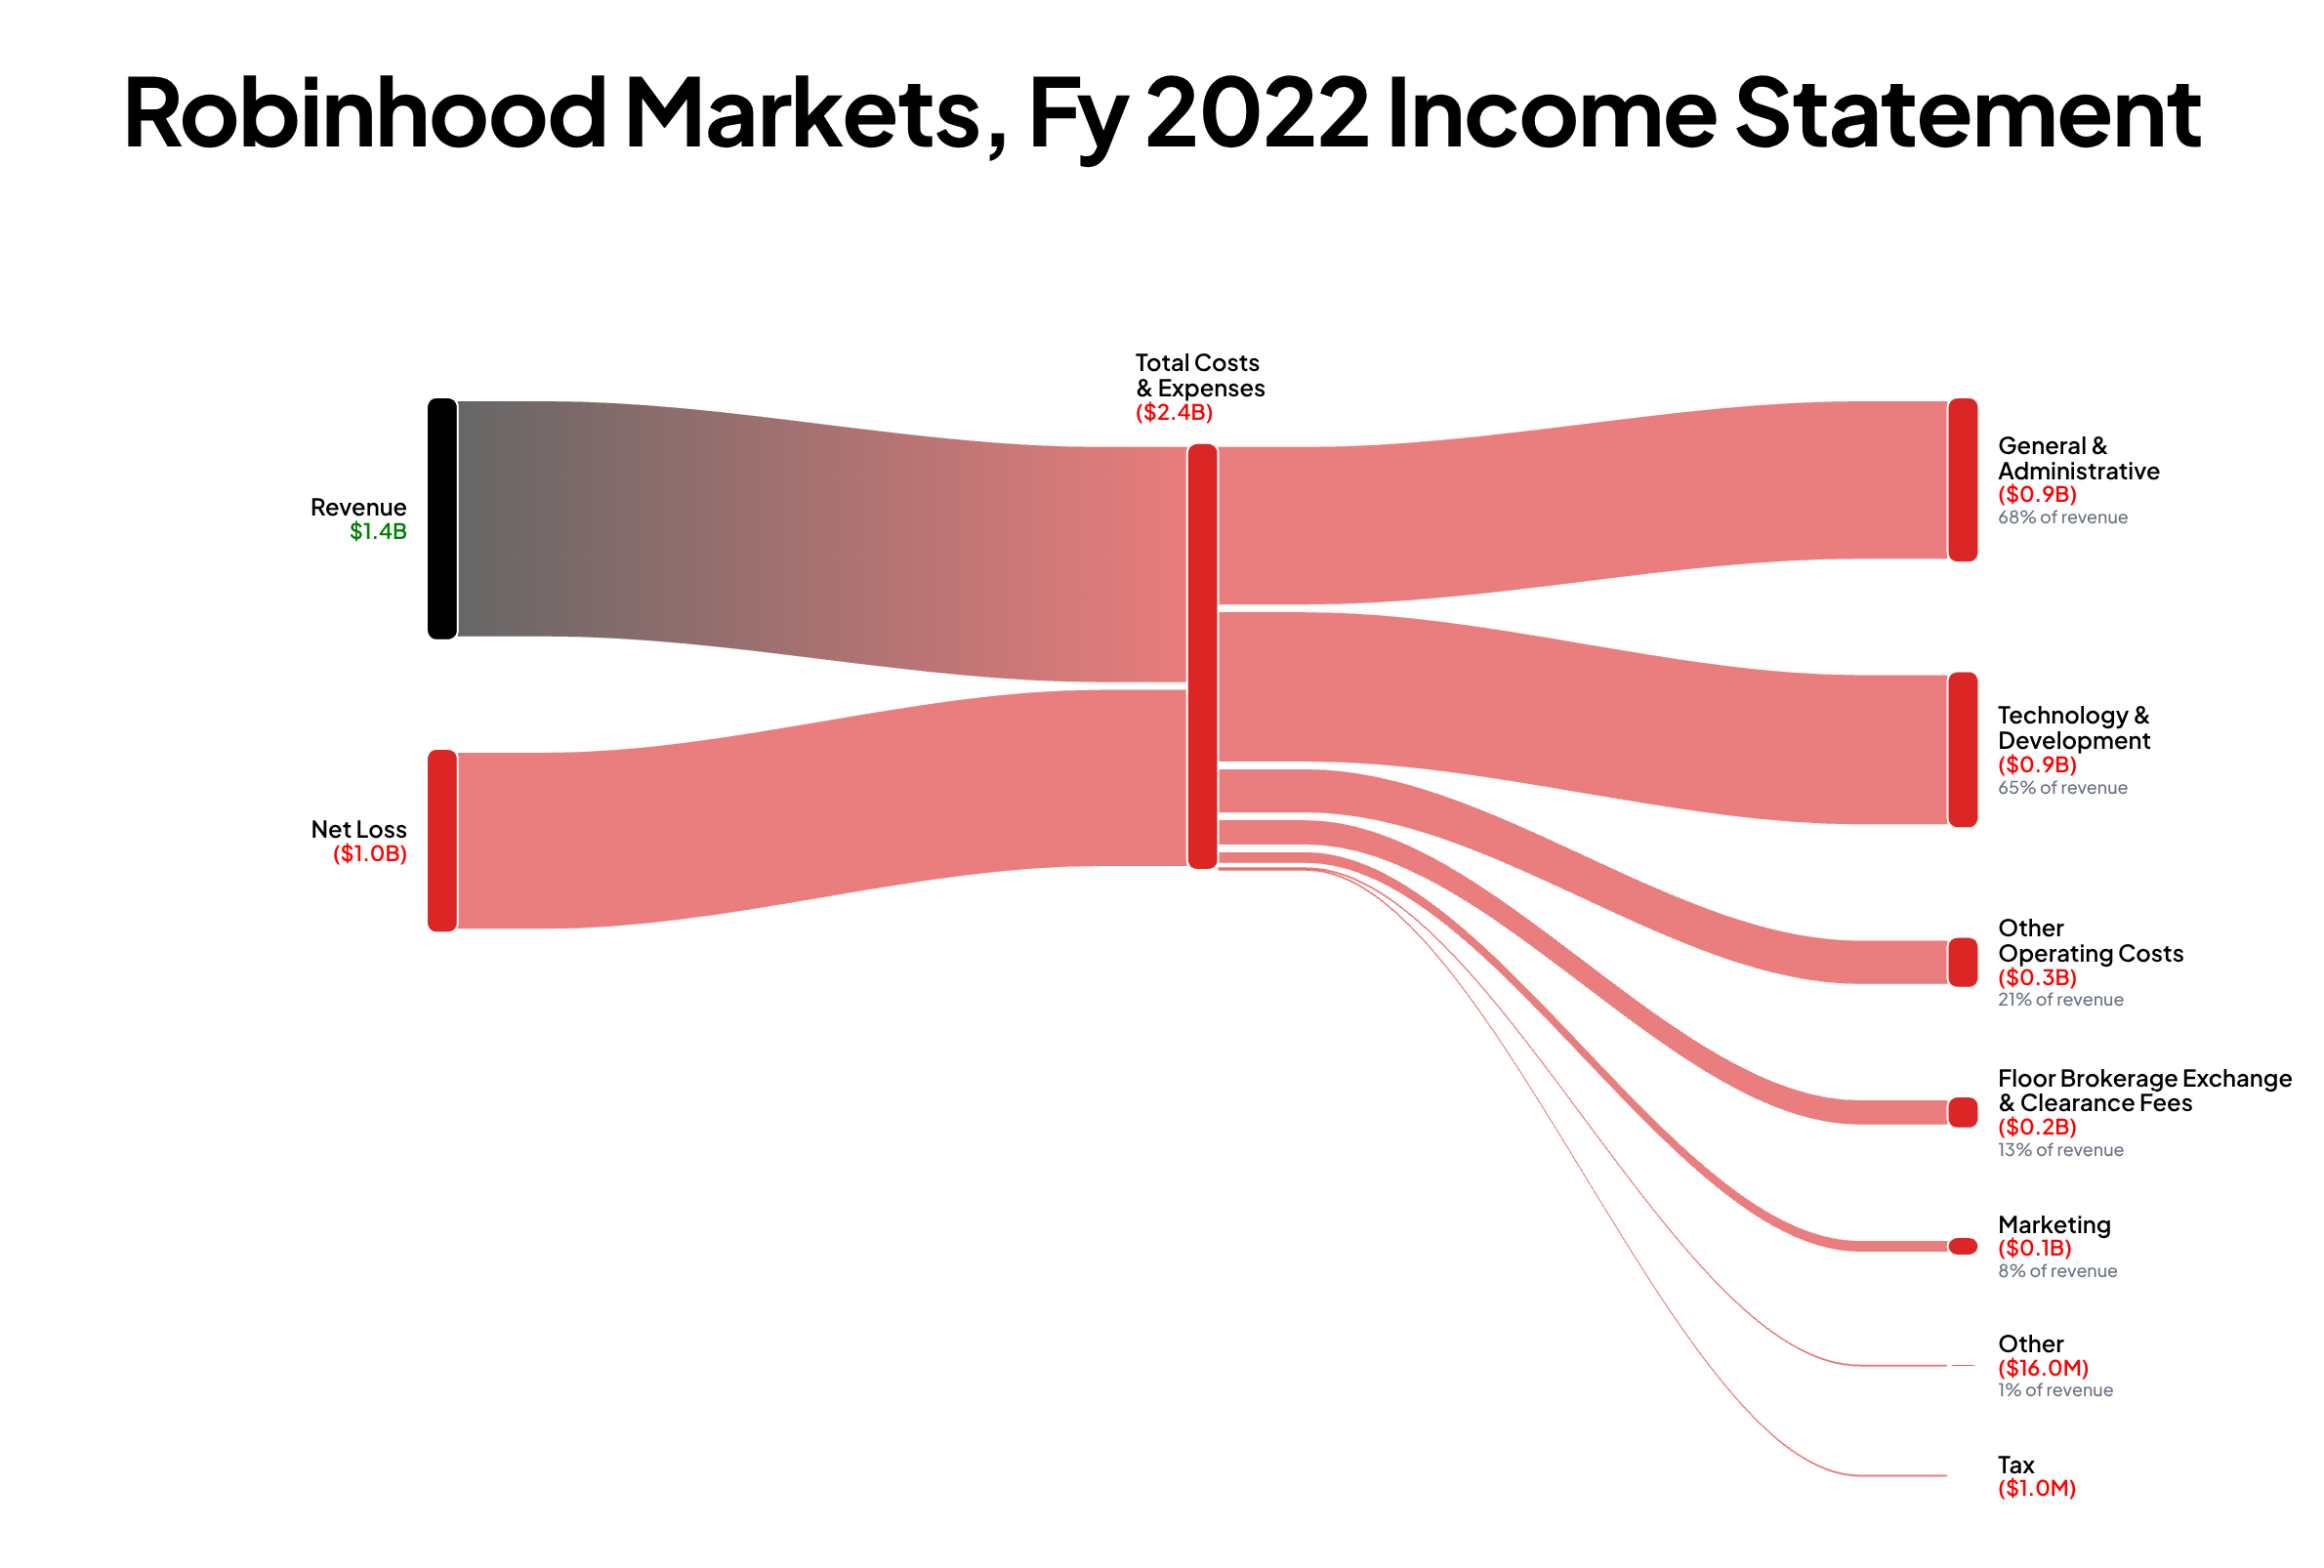
Robinhood Markets, Inc.'s FY2022 revenue was $1.4B, down 25% year over year; net income -$1.0B (-76% margin).
2022 was the crypto winter, and Robinhood's income statement from that year shows exactly how exposed the business still was to swings in trading volume across every product line it offered at the time. Revenue fell 25% as retail trading activity cooled across the board, and the net loss widened to just over $1 billion. Unlike 2021, this loss was not a one-time accounting artifact. It came from a business still built almost entirely on transaction volume. Costs stayed put.
Open the interactive HOOD chart →
---
Robinhood Markets, Inc. (HOOD), Fiscal 2023
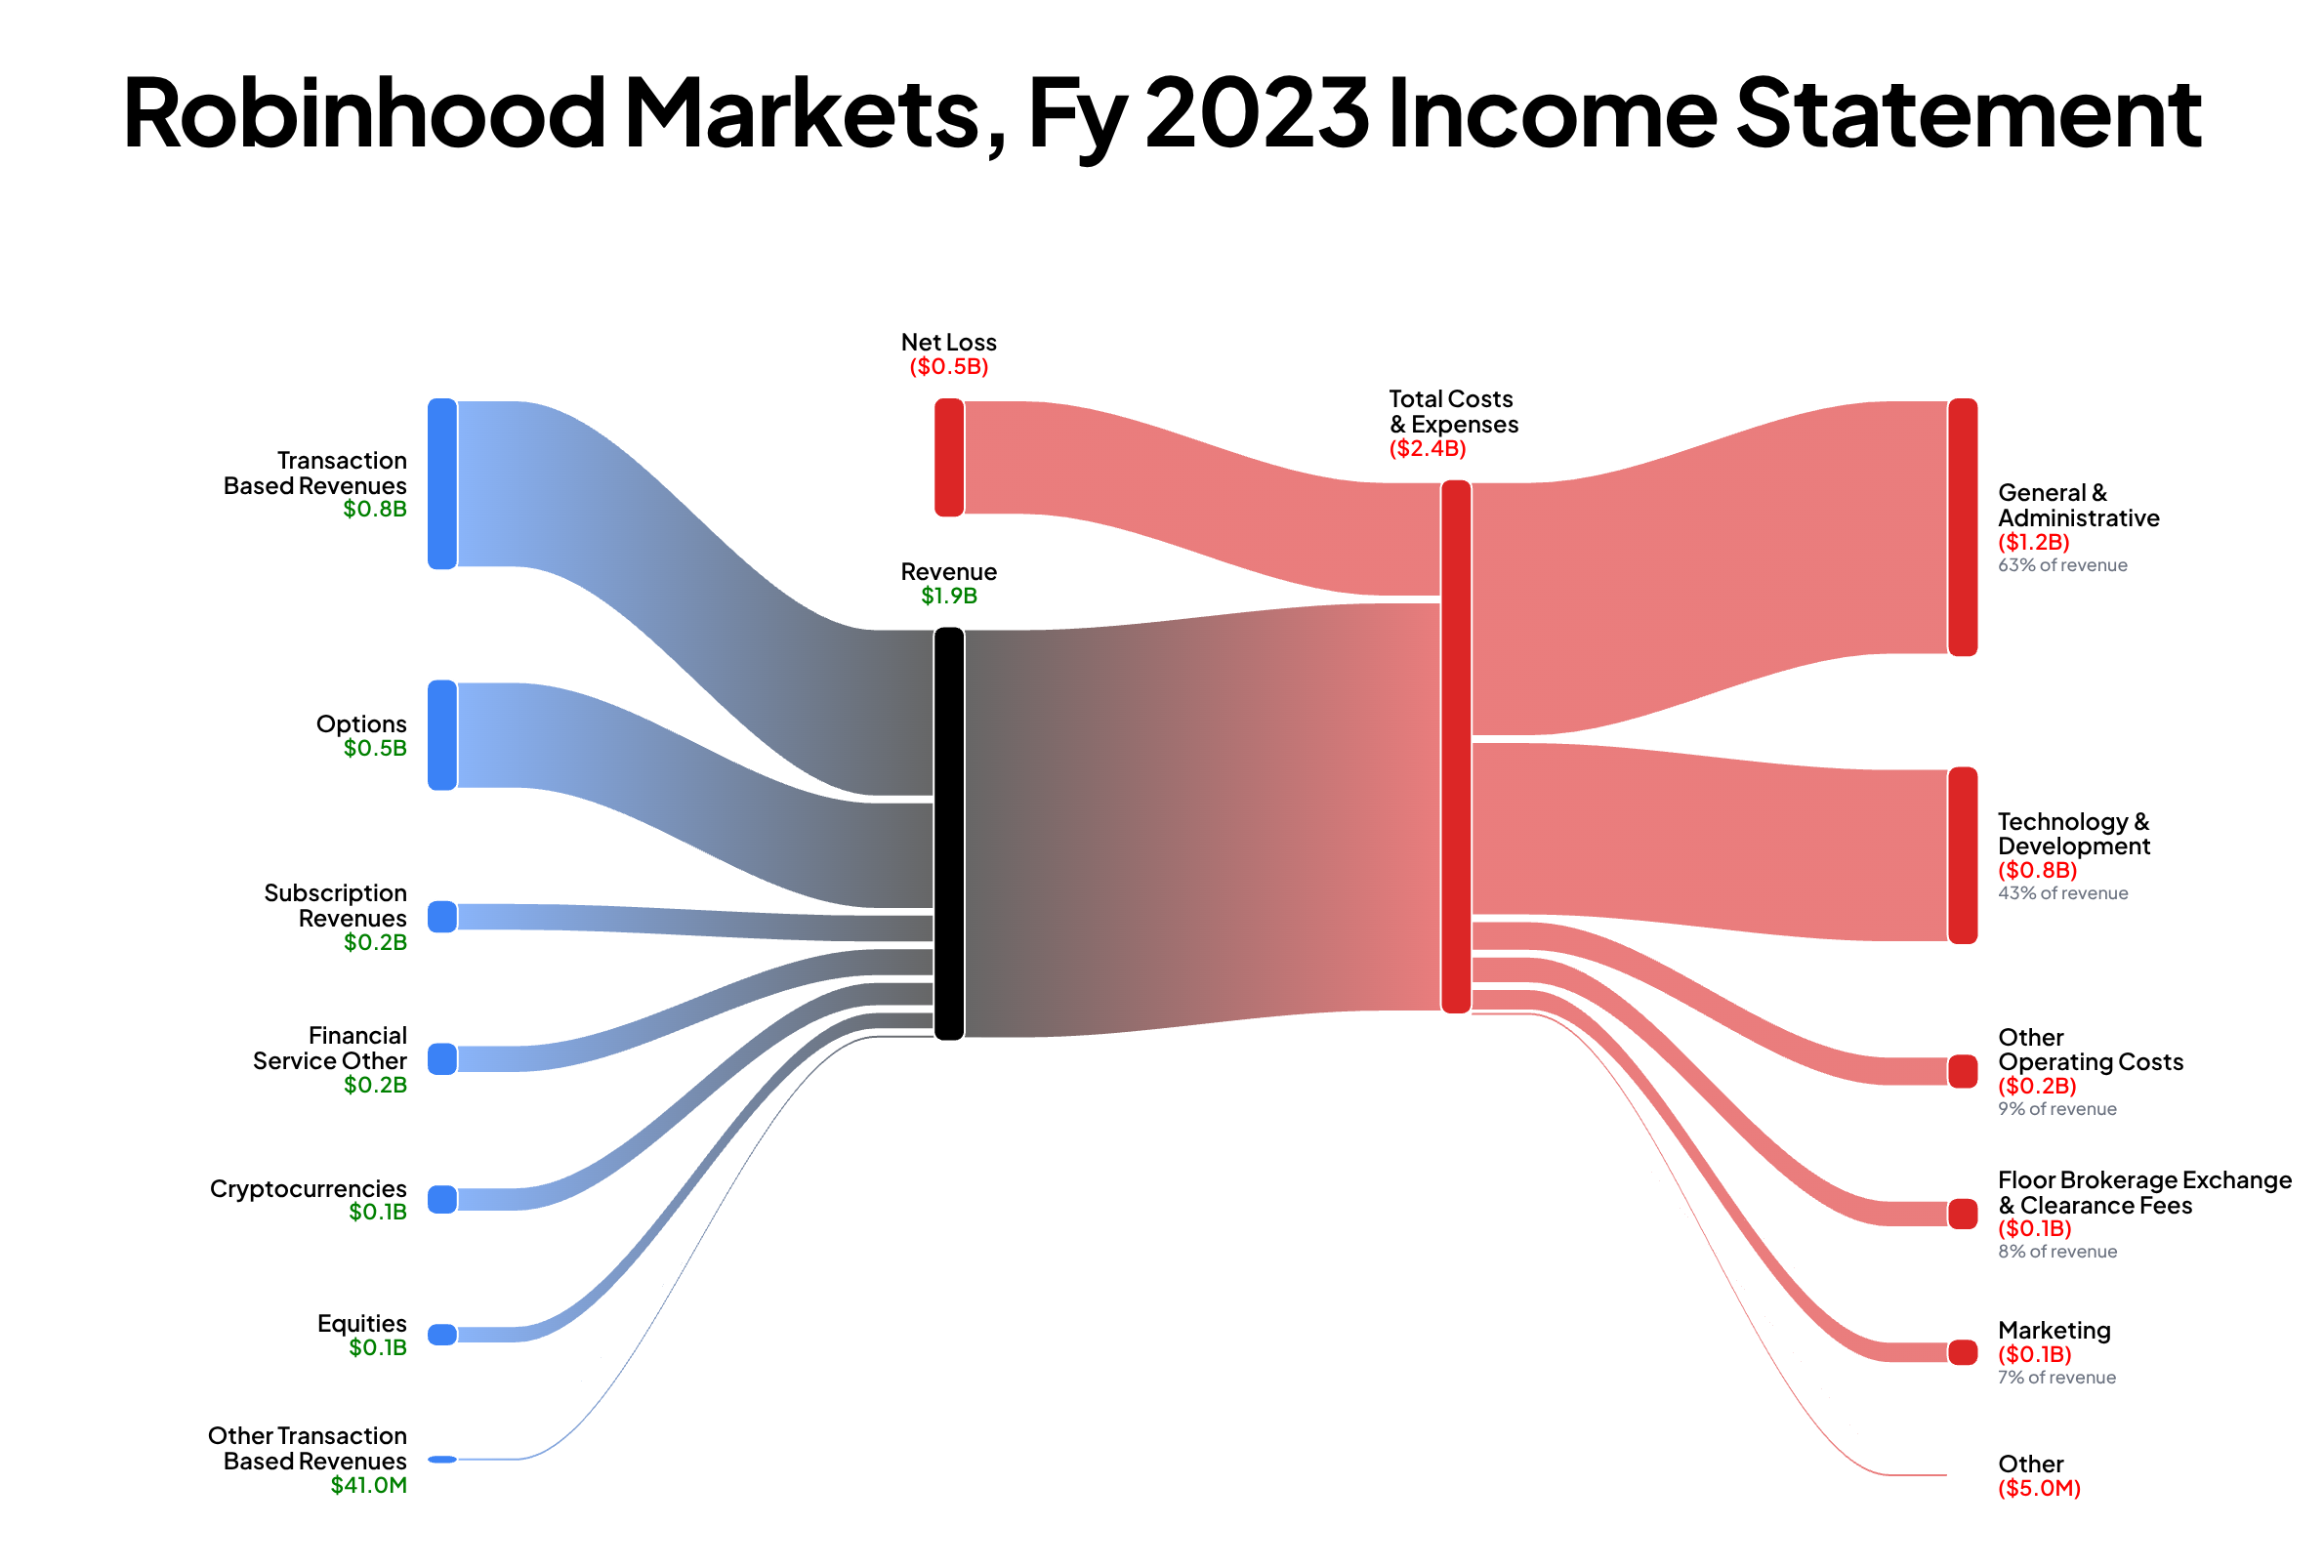
Robinhood Markets, Inc.'s FY2023 revenue was $1.9B, up 37% year over year; net income -$541M (-29% margin).
By 2023, trading activity had come back. Revenue grew 37% to $1.9 billion. The company was still unprofitable, but the loss had narrowed to $541 million from just over $1 billion the year before, proof the business could shrink a loss even without a crypto rally to lean on. Robinhood spent 2023 leaning harder into subscriptions and cash management, the parts of the business that do not depend on how often customers trade.
Open the interactive HOOD chart →
---
Robinhood Markets, Inc. (HOOD), Fiscal 2024
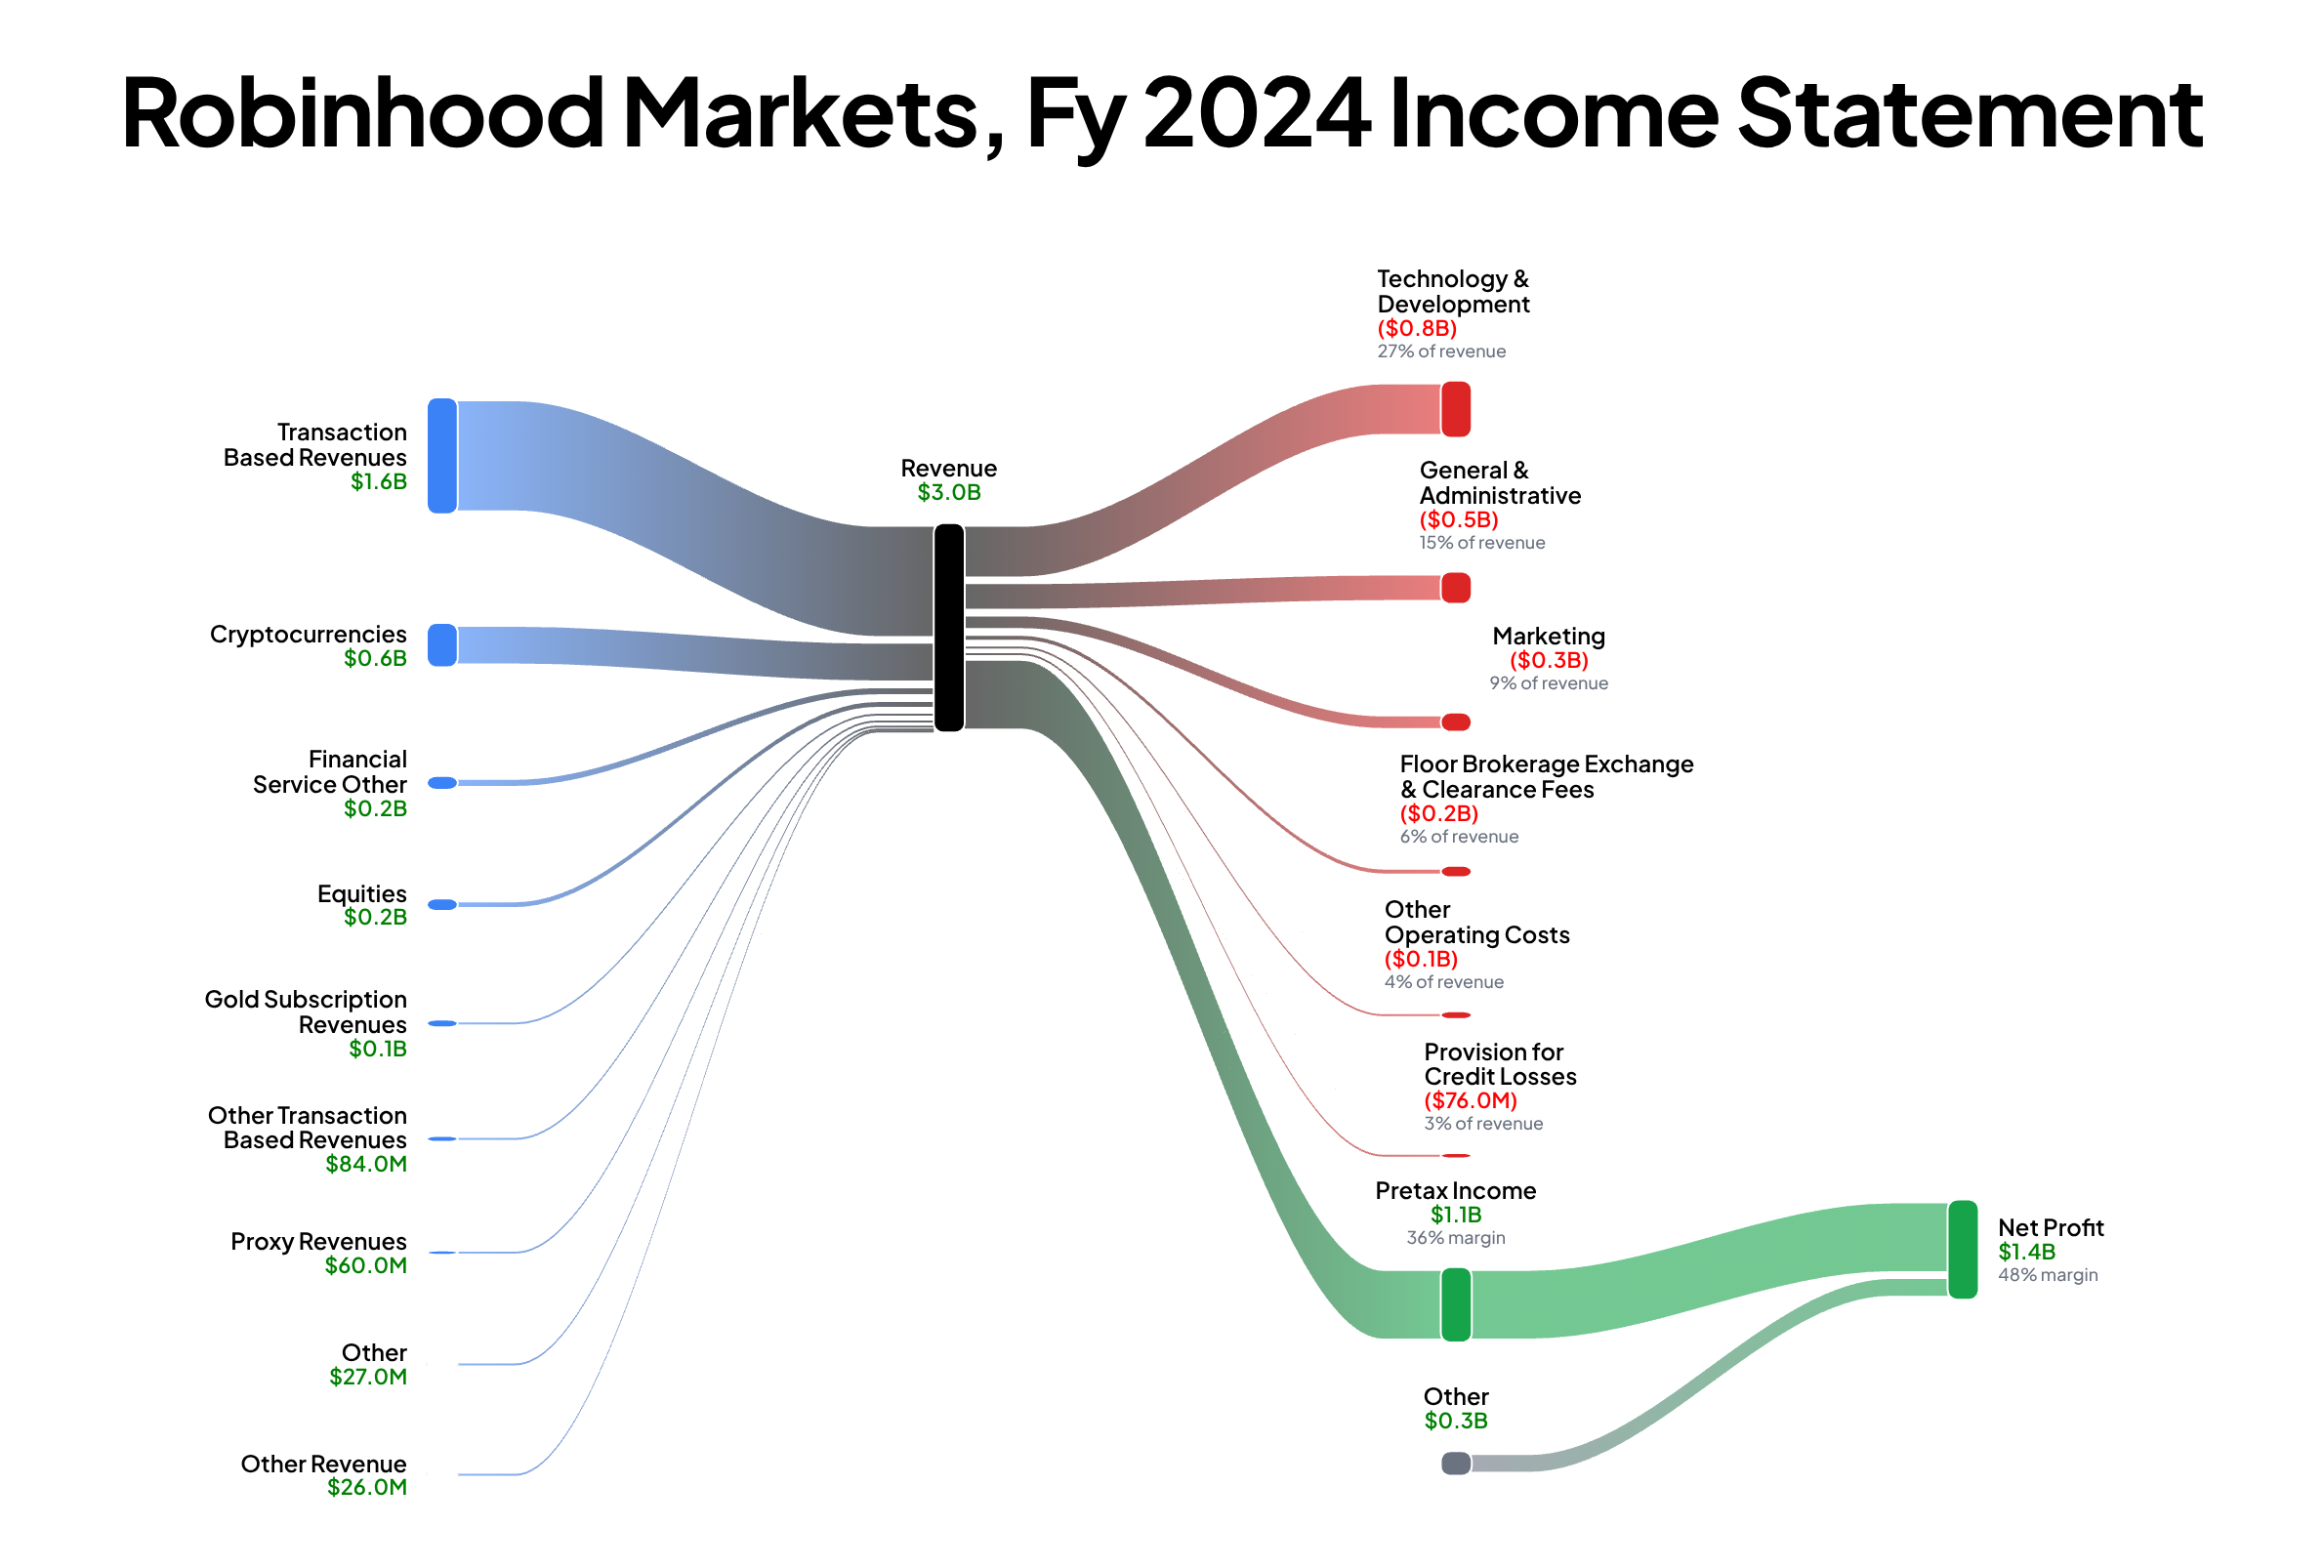
Robinhood Markets, Inc.'s FY2024 revenue was $3.0B, up 58% year over year; net income $1.4B (48% margin).
2024 was Robinhood's first full year of profitability since 2020, according to the company's own Q4 2024 earnings release. Revenue jumped 58% to $2.95 billion, and for the first time since the IPO, growth showed up directly in net income: $1.41 billion, a 48% margin. Crypto came back hard, with crypto revenue up more than 700% for the year on renewed trading activity, according to the same release. Options and subscriptions kept growing too, quietly.
Open the interactive HOOD chart →
---
Robinhood Markets, Inc. (HOOD), Fiscal 2025
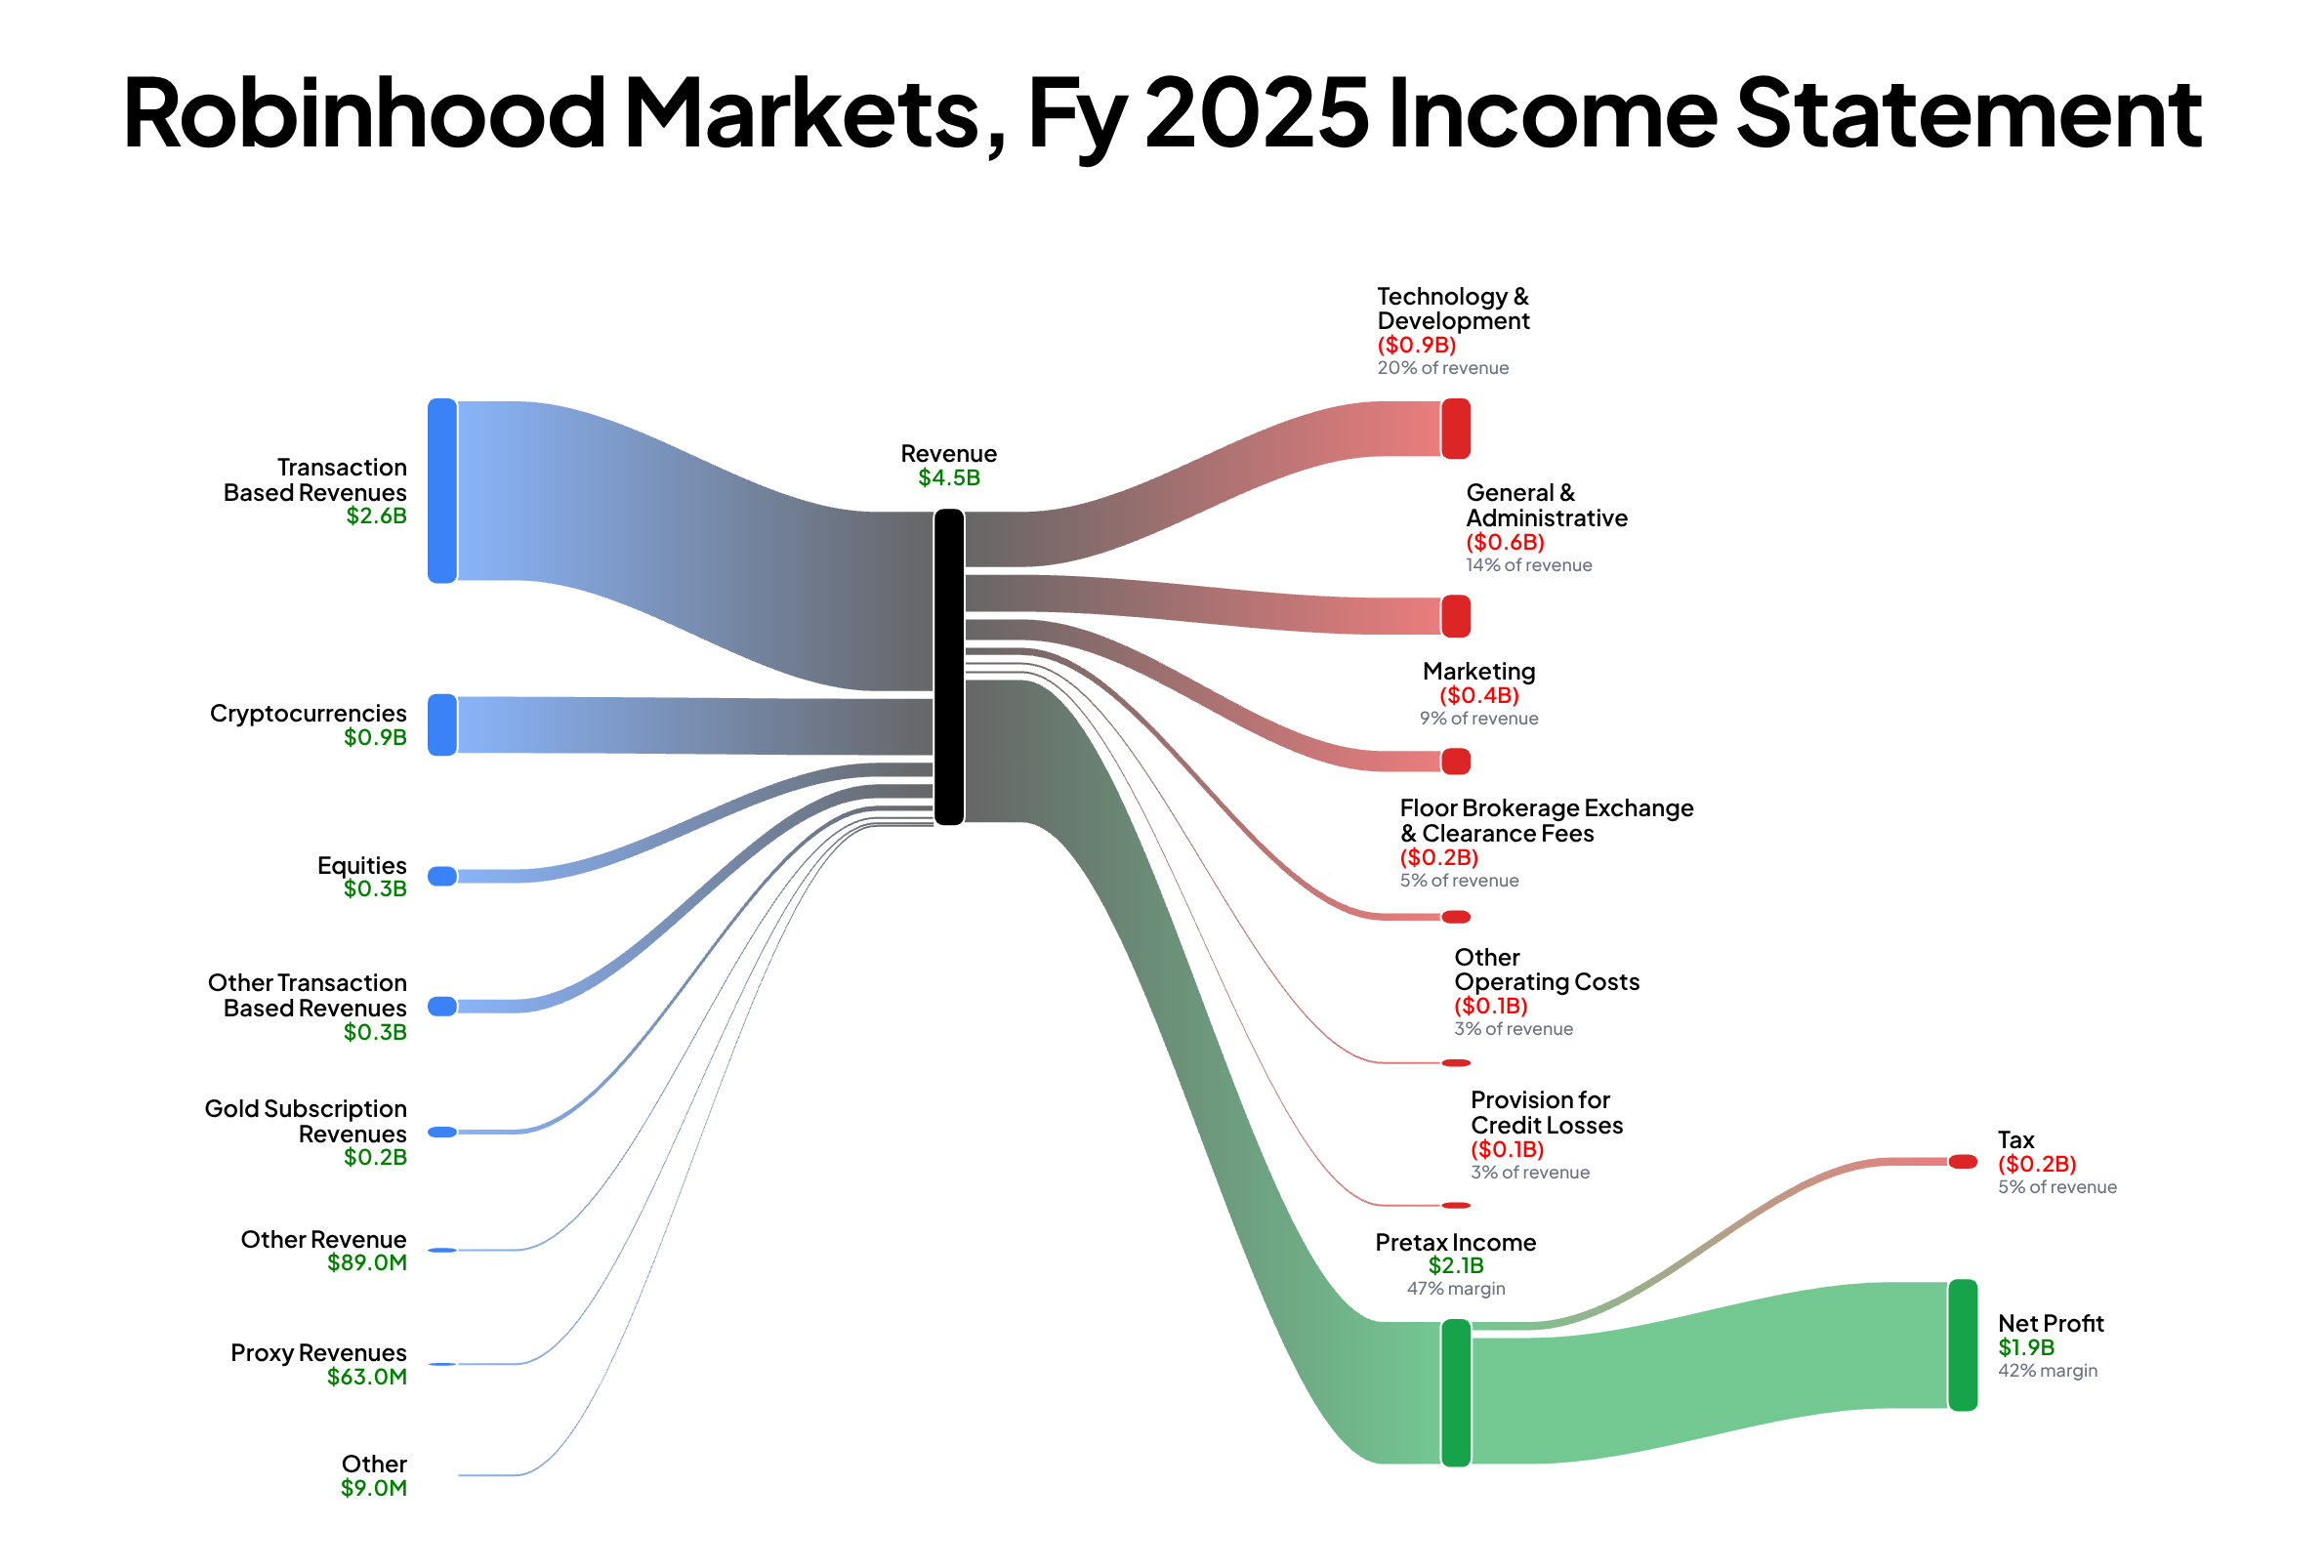
Robinhood Markets, Inc.'s FY2025 revenue was $4.5B, up 52% year over year; net income $1.9B (42% margin).
By fiscal 2025, Robinhood was posting its second straight profitable year, and the mix of the business had shifted again. Revenue reached $4.47 billion, up 52%, with net income of $1.88 billion. The clearest sign of where the company is headed showed up a quarter later: in Q2 2026, event-contract revenue from Robinhood's prediction markets business hit $156 million, more than ten times the prior year and, for the first time, ahead of both crypto and equities trading revenue, according to the company's Q2 2026 results. Options remained the single largest transaction category. Crypto, the business that defined Robinhood's 2021 and 2022 swings, is no longer the fastest-growing part of the company.
Open the interactive HOOD chart →
---
Line up all five charts and the story is not really about crypto, or meme stocks, or even prediction markets specifically. It is about a company that spent its first two years as a public company subsidizing growth with investor capital and IPO accounting noise, then spent the next three converting an already-large user base into steadier, more diverse revenue. Tenev's "supercycle" comment is a bet that tokenization becomes the next leg of that same pattern. The five income statements above are the only independent evidence anyone has for whether that bet is working. Numbers don't spin.
_Every chart on this page was rendered by Sankify from the company's own SEC filings. Nothing here is illustrative or mocked up._
See Financial Data Differently
Transform complex income statements into interactive Sankey diagrams. Understand where the money flows in seconds.
Try Sankify Free